Note: sometimes the daily temperature is not taken

Total number of Shore Station samples collected at SE Farallon Island:

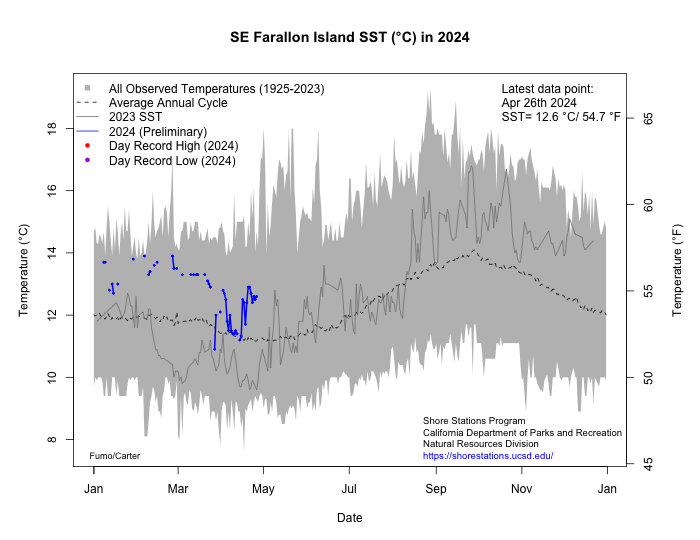
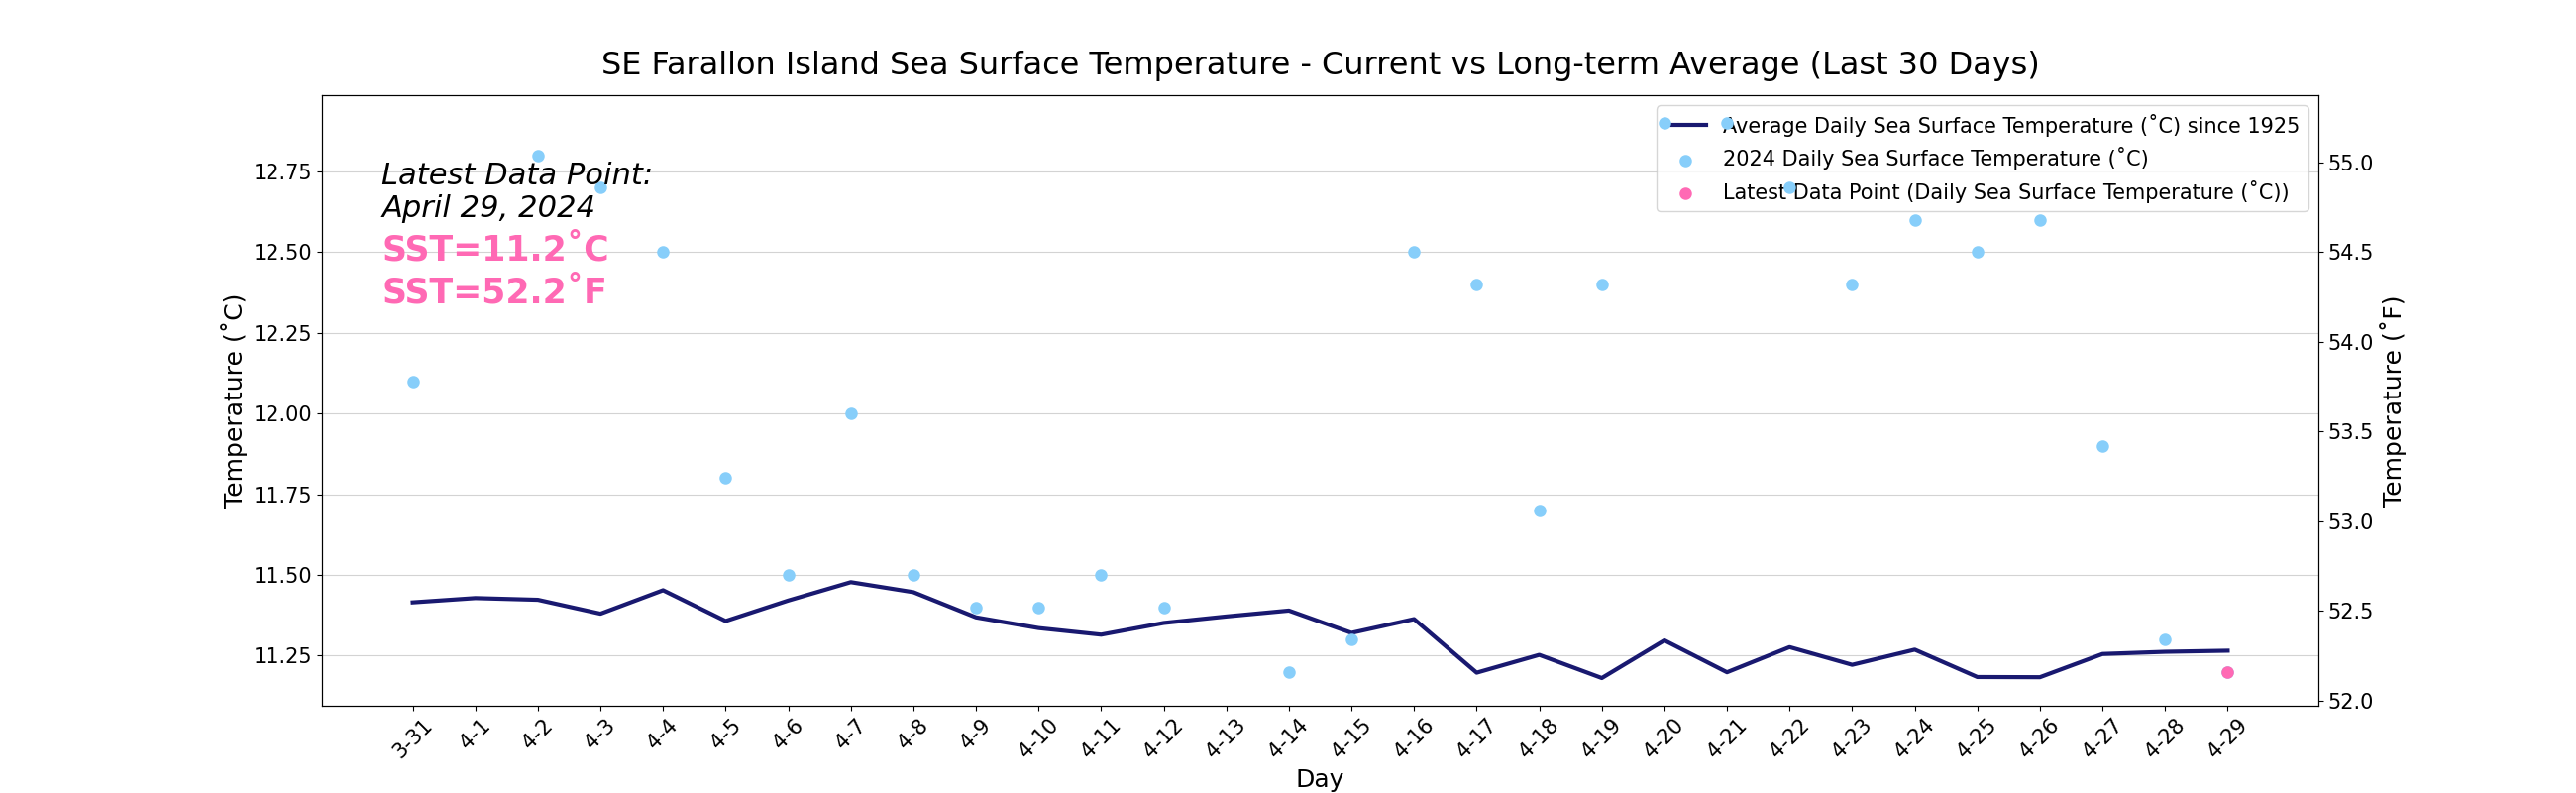
See how the daily temperature reading compares to the long term average:

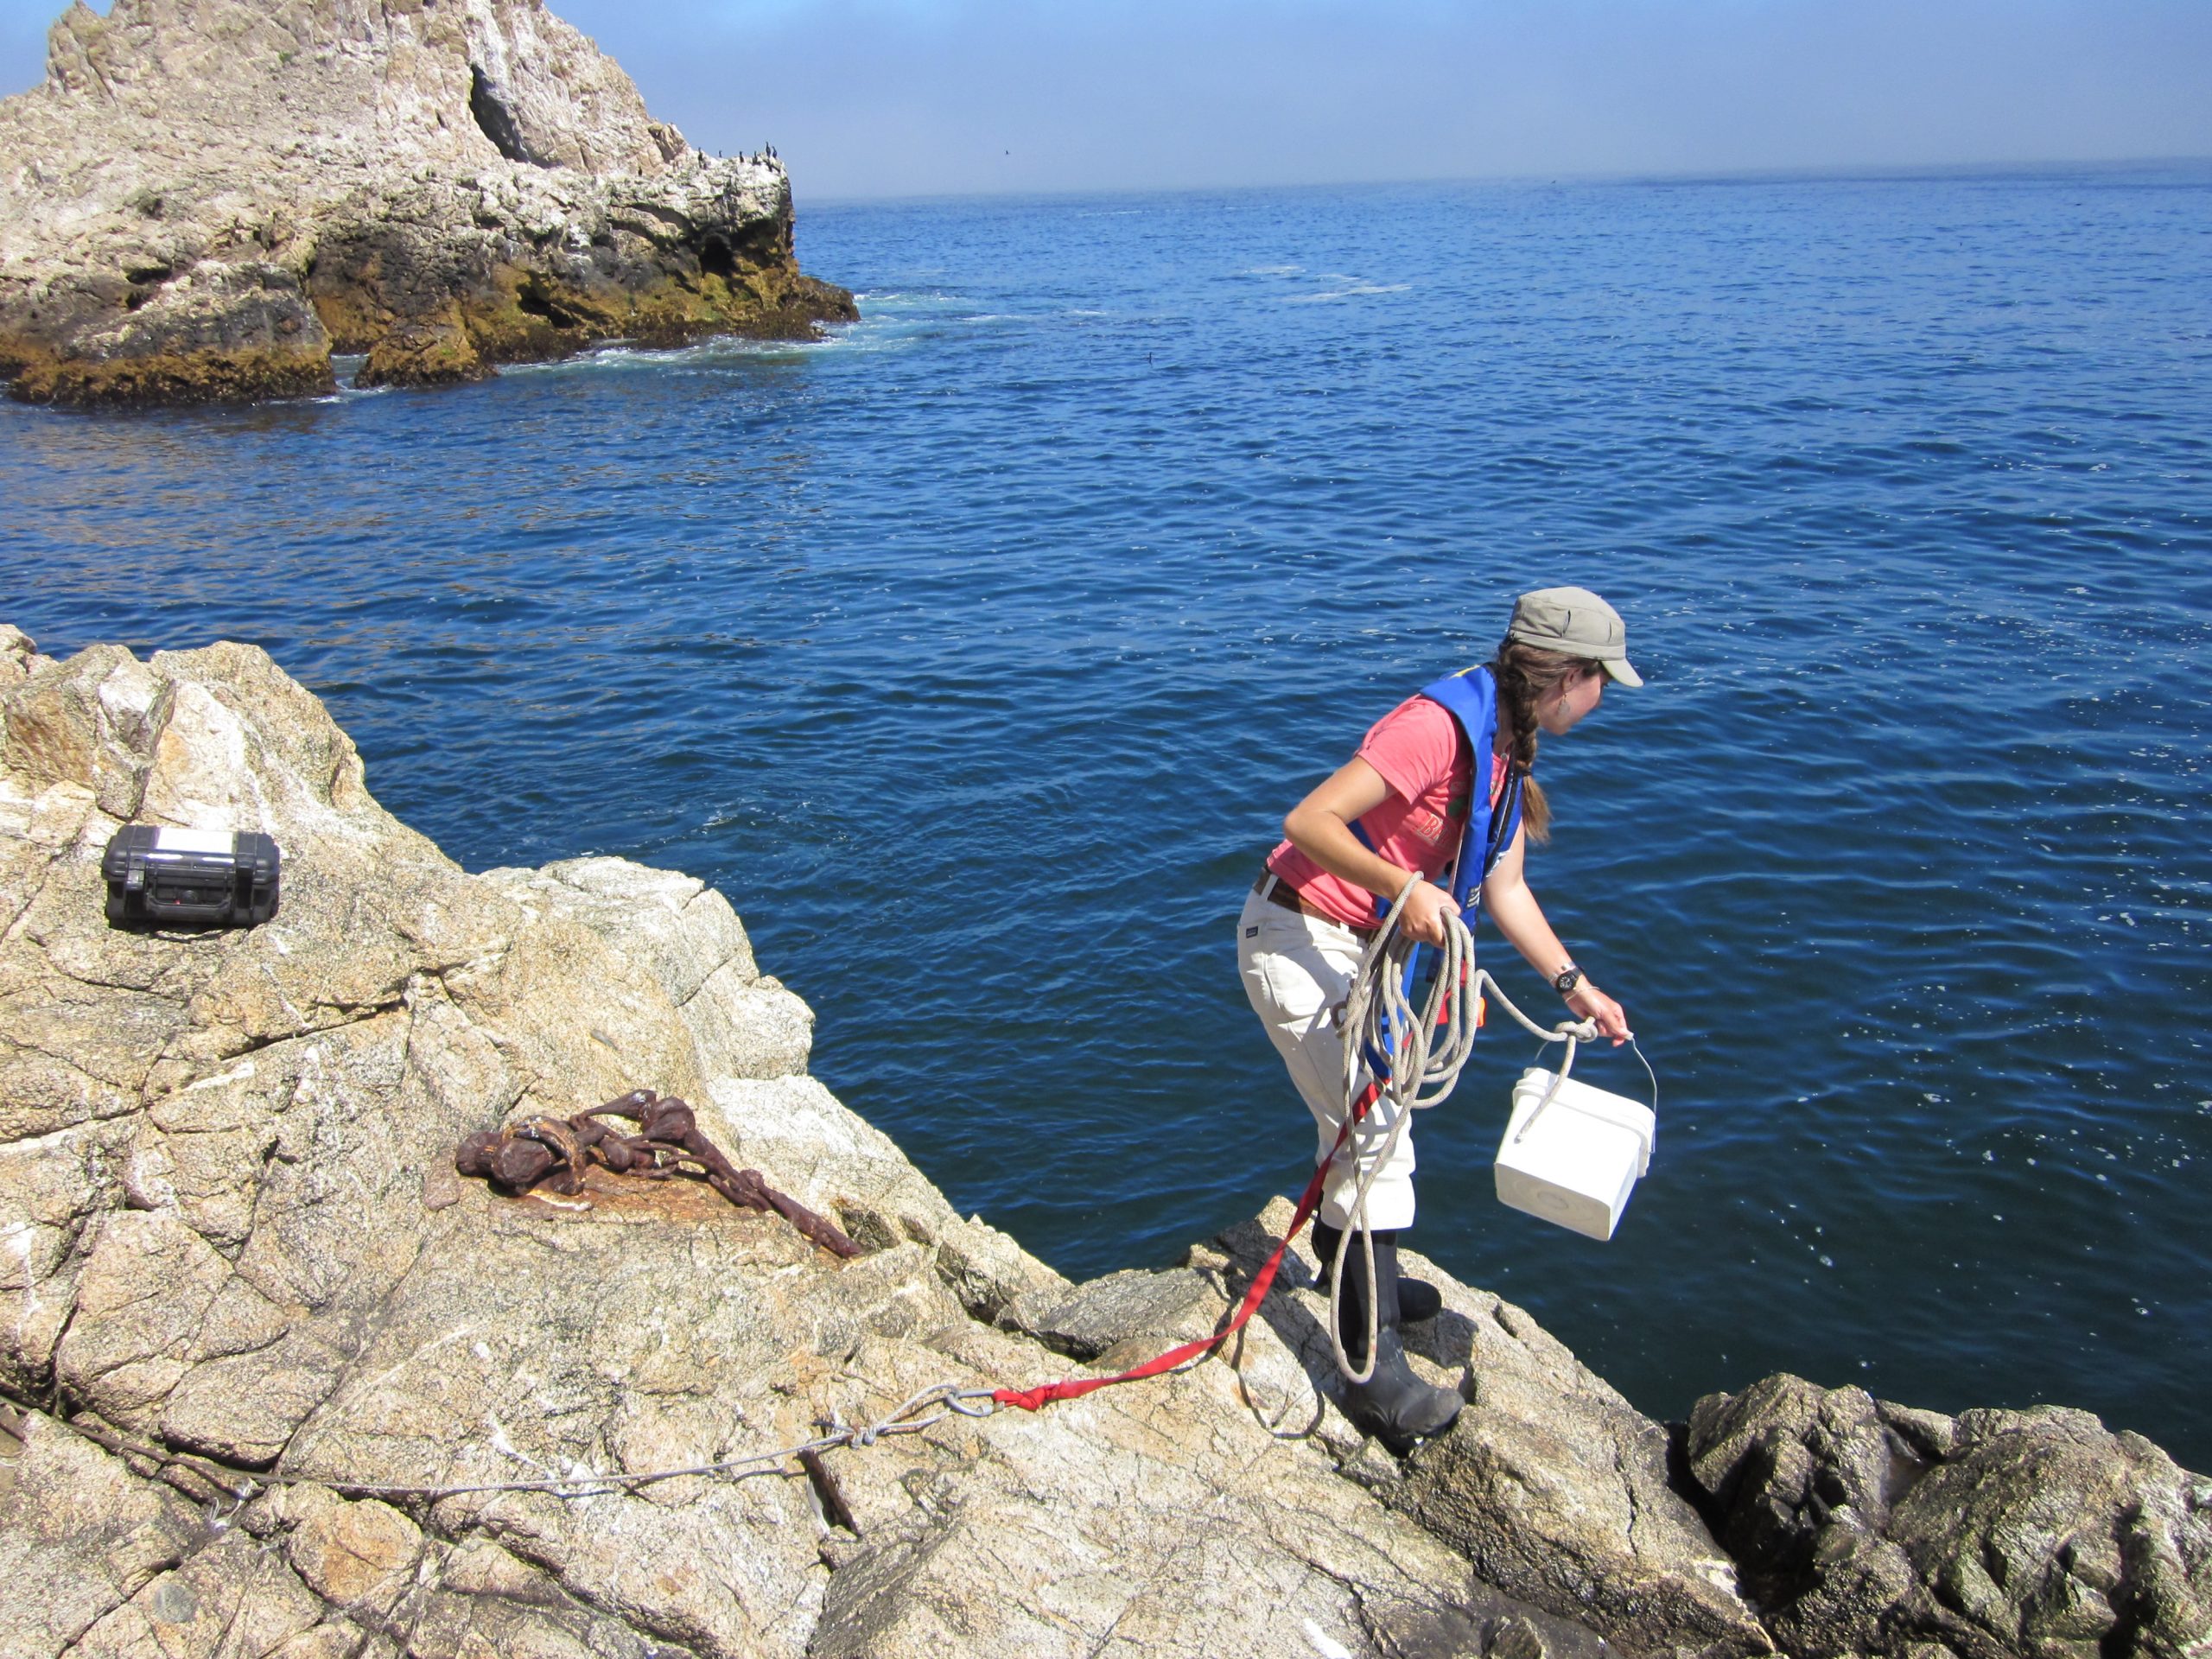
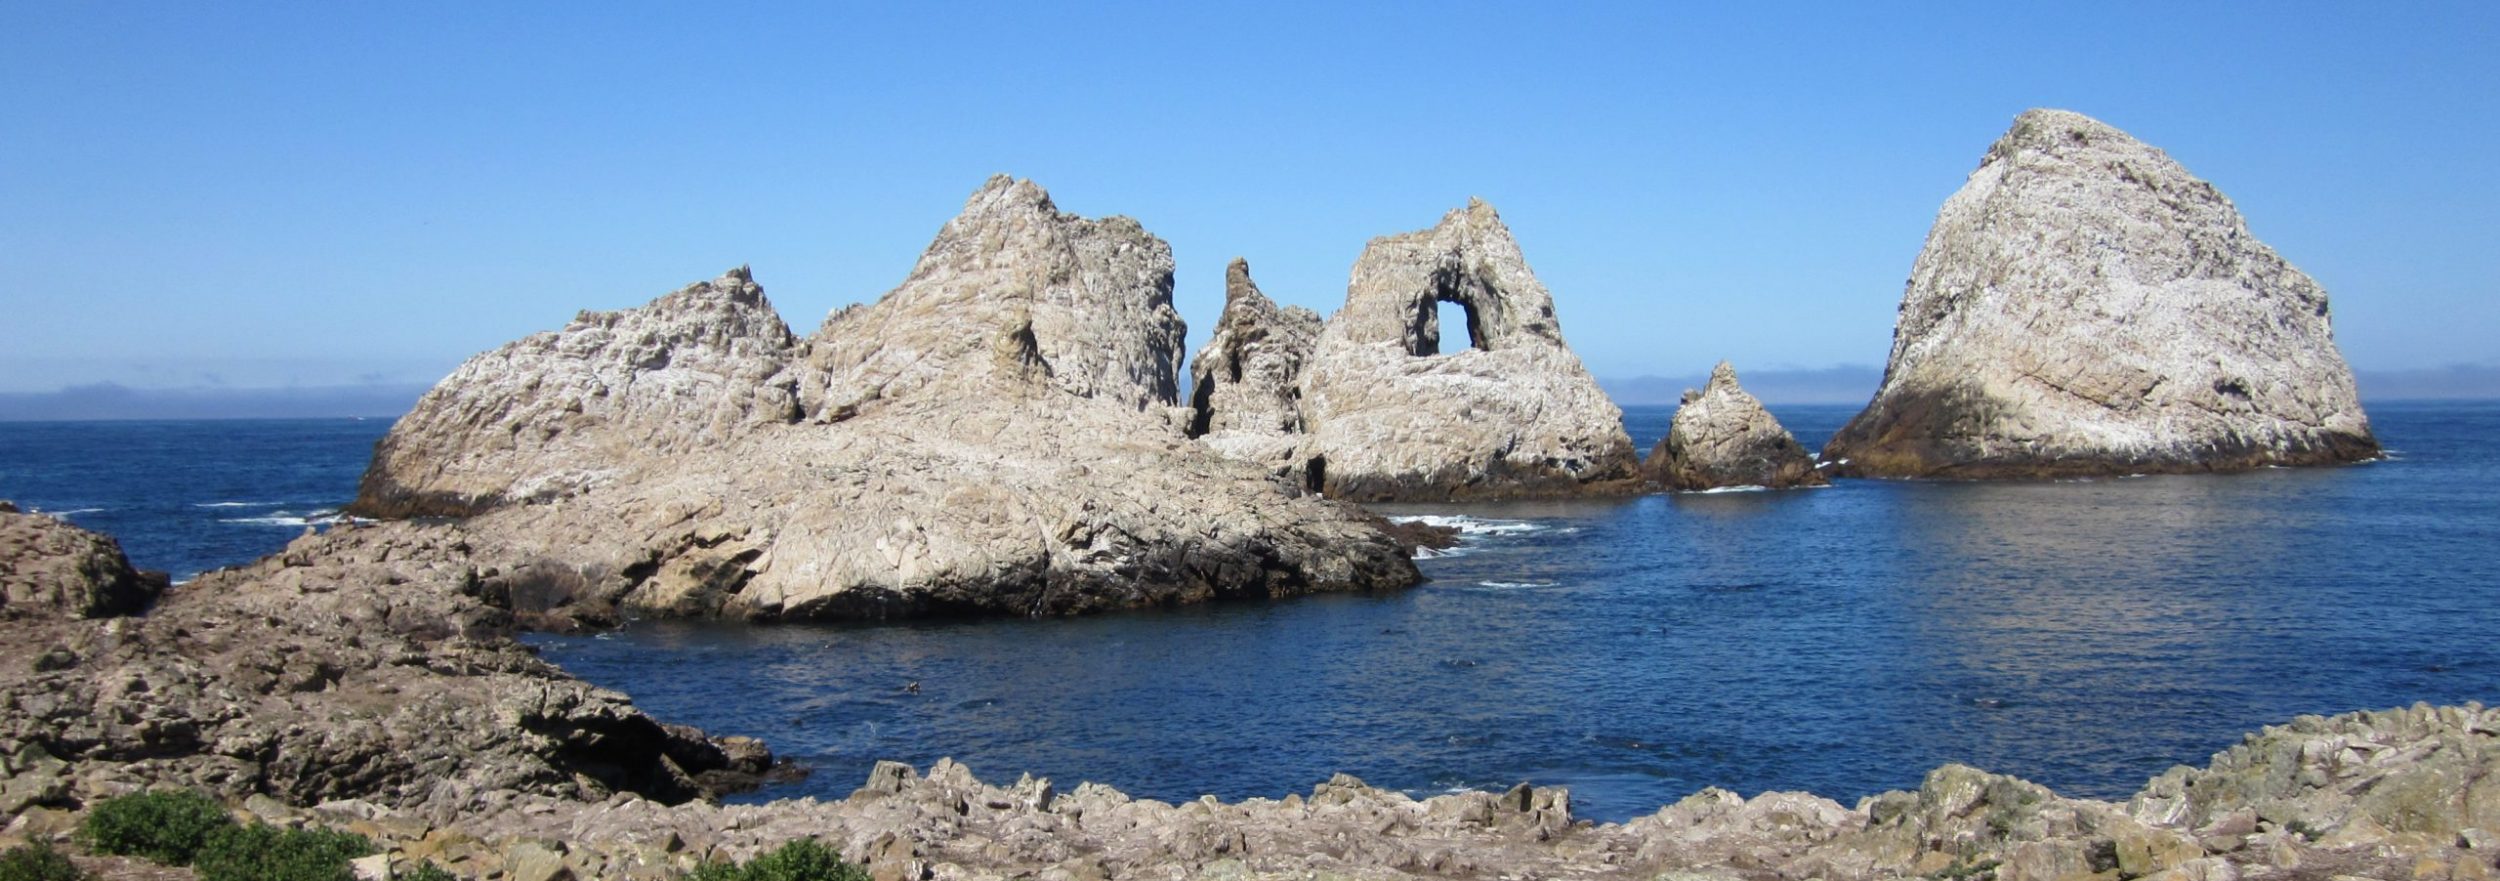
The Farallon Islands, seven rocky islands comprising the Farallon Islands National Wildlife Refuge, are the breeding grounds for more than one-quarter of all California seabirds and home to populations of seals and sea lions. The largest seabird colony south of Alaska, this critical habitat provides protection for 12 different species, numbering more than 200,000 individuals.
As a small part of their ongoing studies, Point Blue Conservation Science researchers stationed on Southeast Farallon take daily temperature and salinity samples and return the salinity samples to Scripps once a month for analysis. Because of their location 26 miles west of the Golden Gate Bridge, where they catch the full force of winter storms and the strong summer northwesters, data collection can be interrupted from time to time. The sampling site at the boat landing on the southeast side of the island is steep and rocky, so measurements are representative of the oceanic waters around the islands.
click here to access farallon islands data from 1925-current
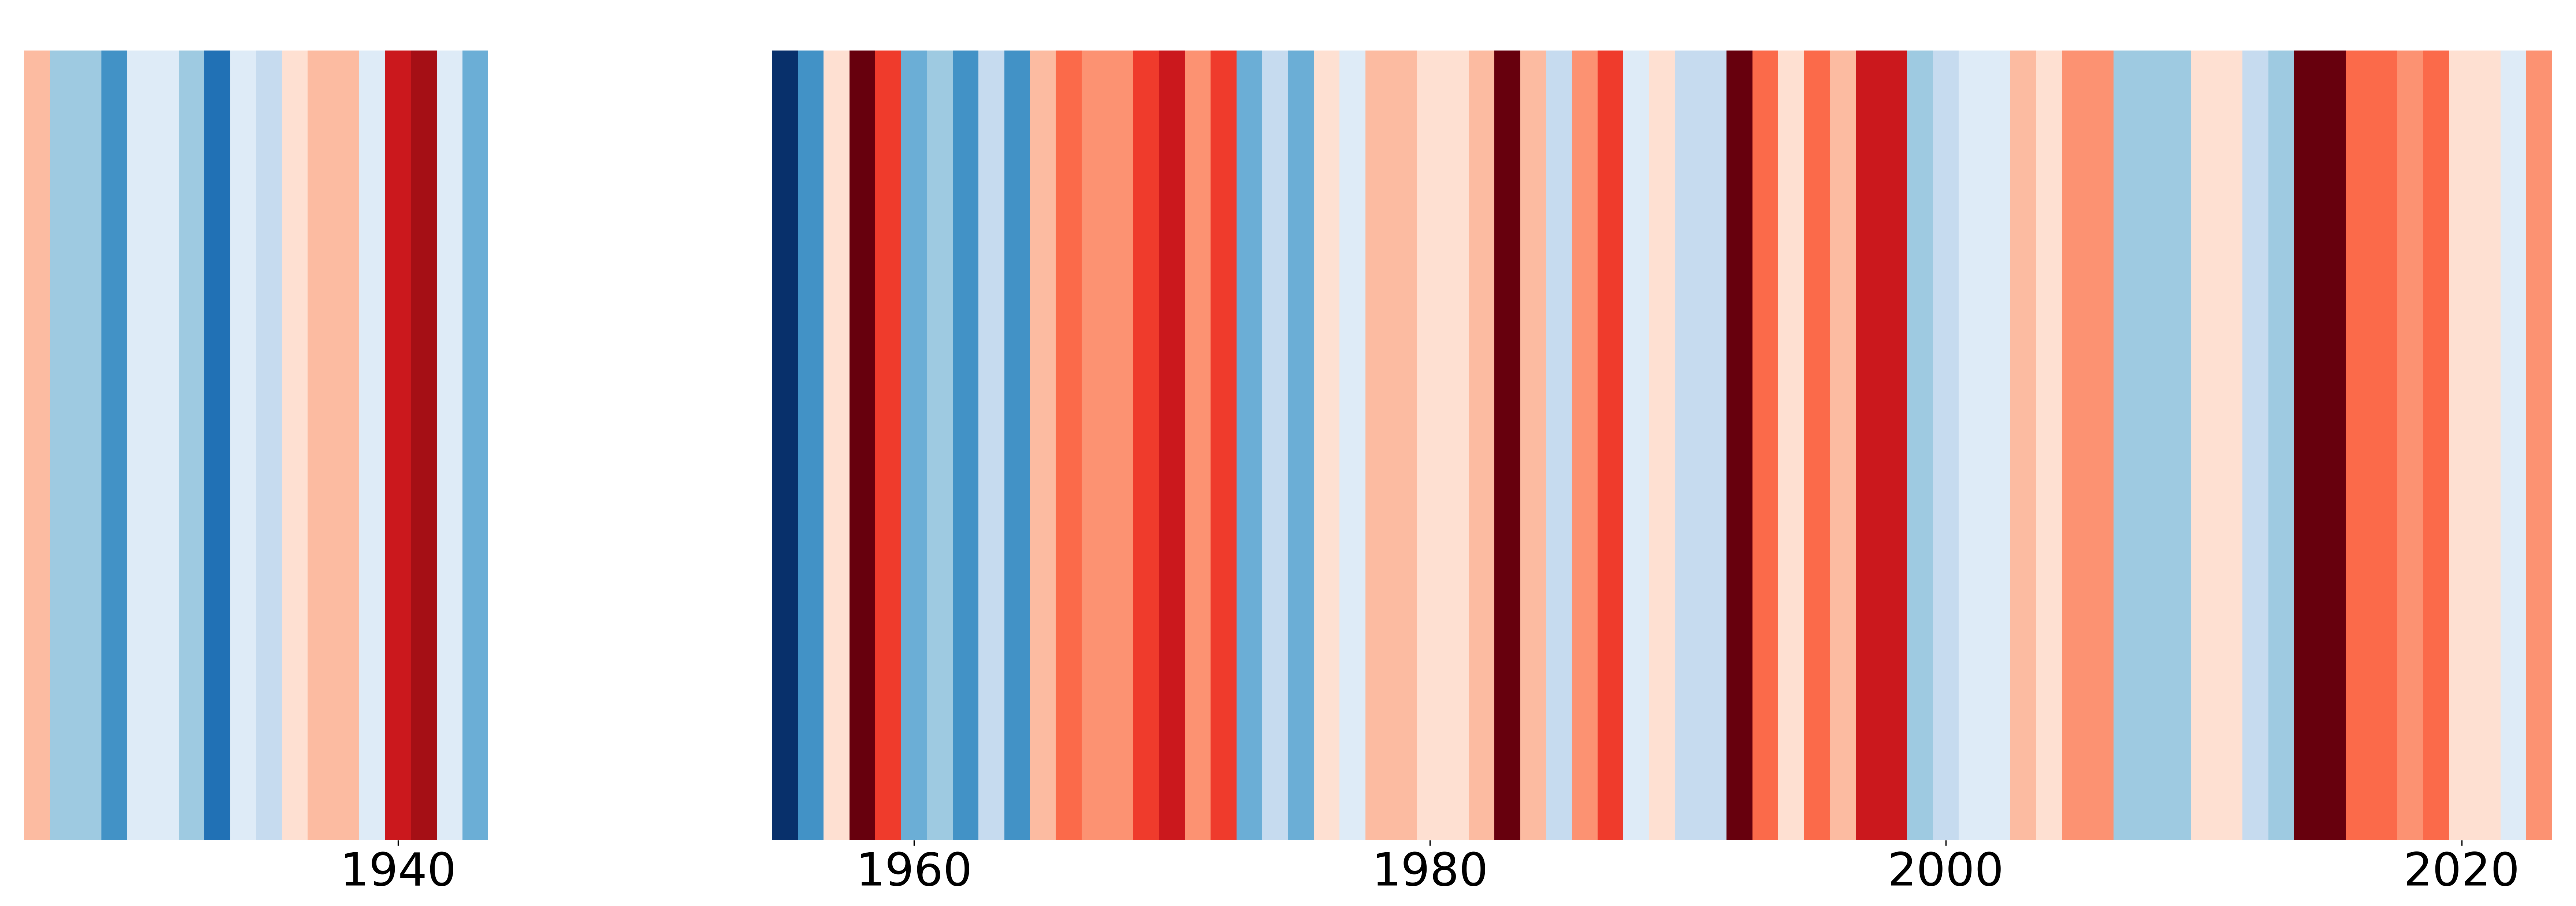
Below are figures that we have modeled after the #ShowYourStripes Campaign (created by Ed Hawkins), to help us visualize how sea surface temperature has changed at SE Farallon Island since 1925. The change in temperature is relative to the average temperature calculated between 1925-2023.
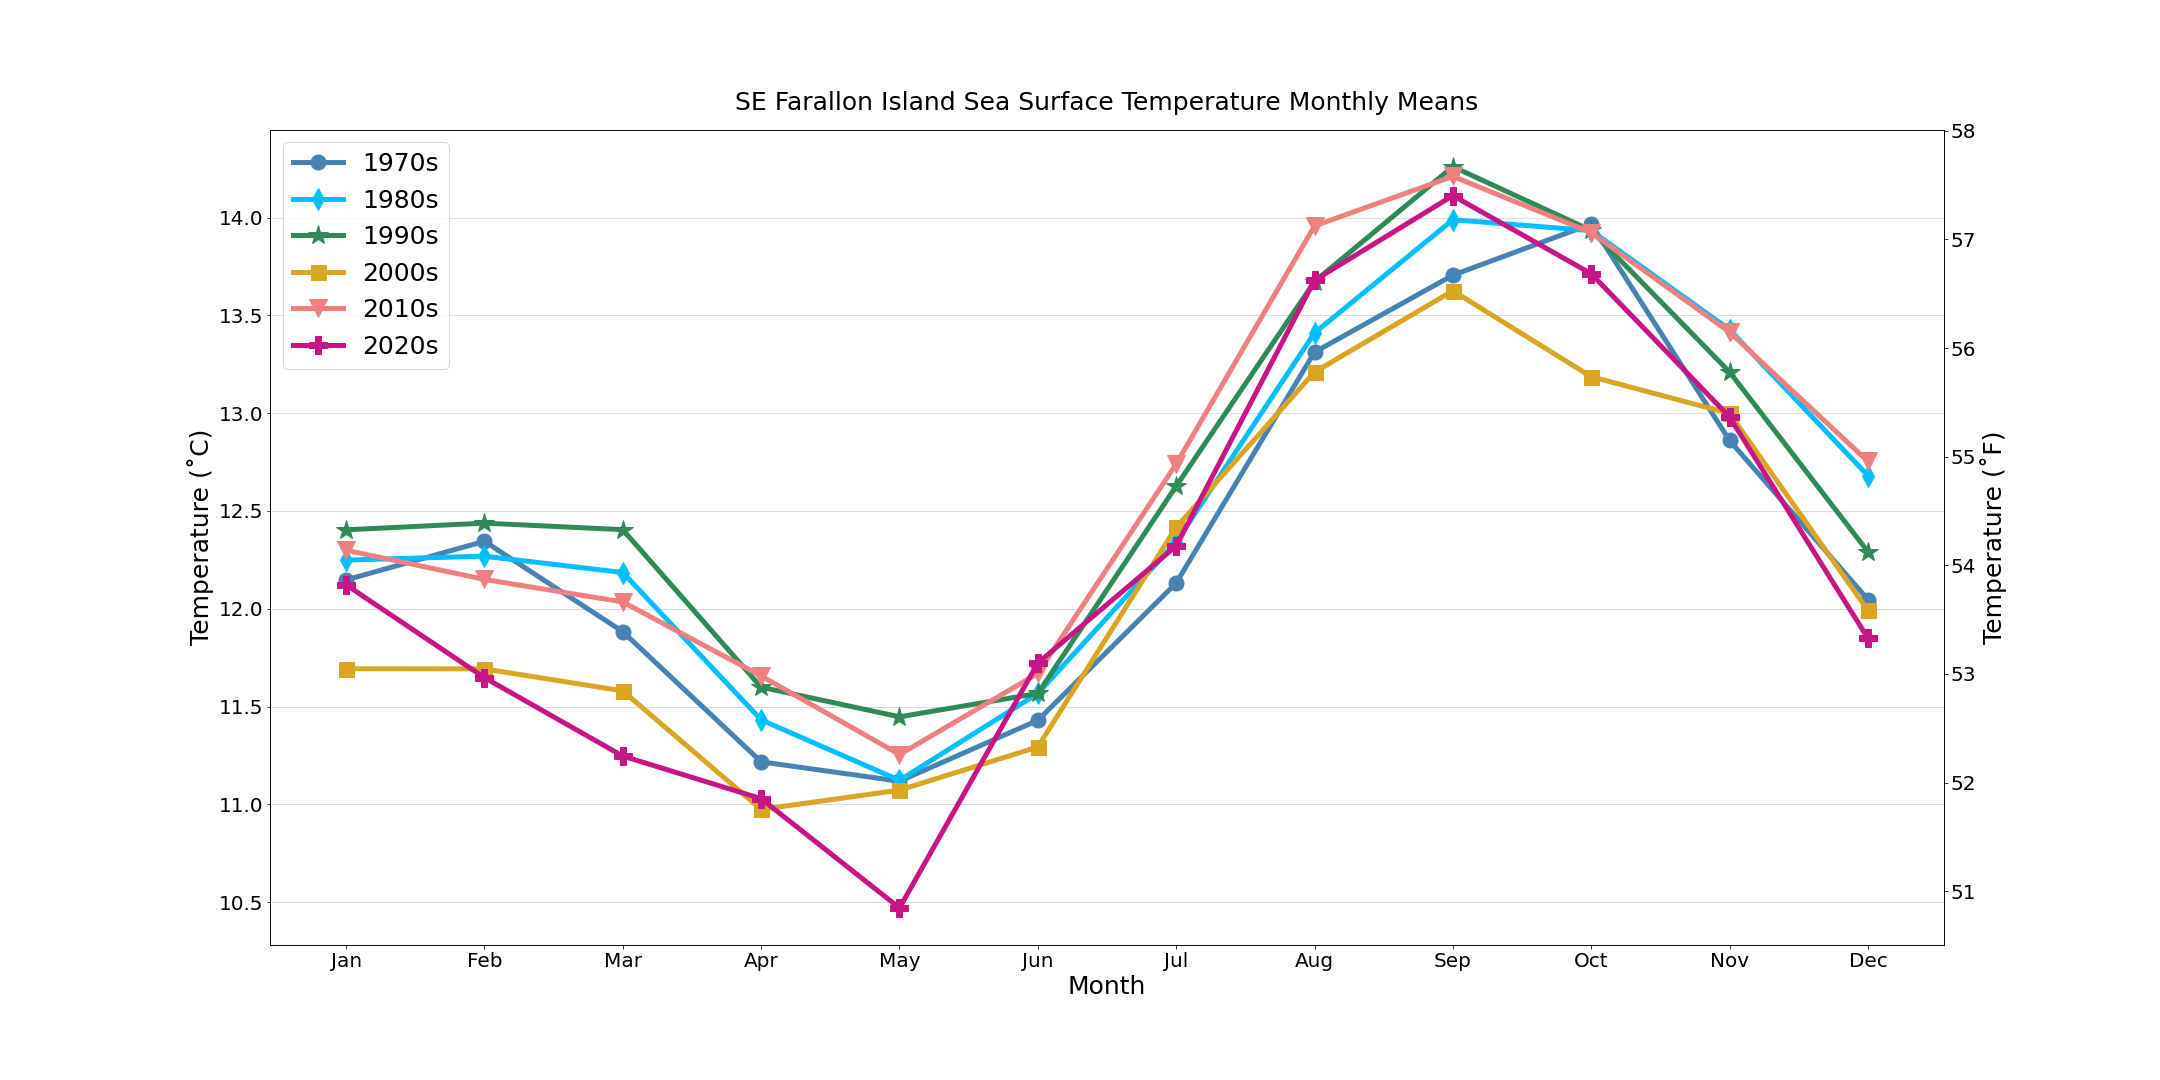
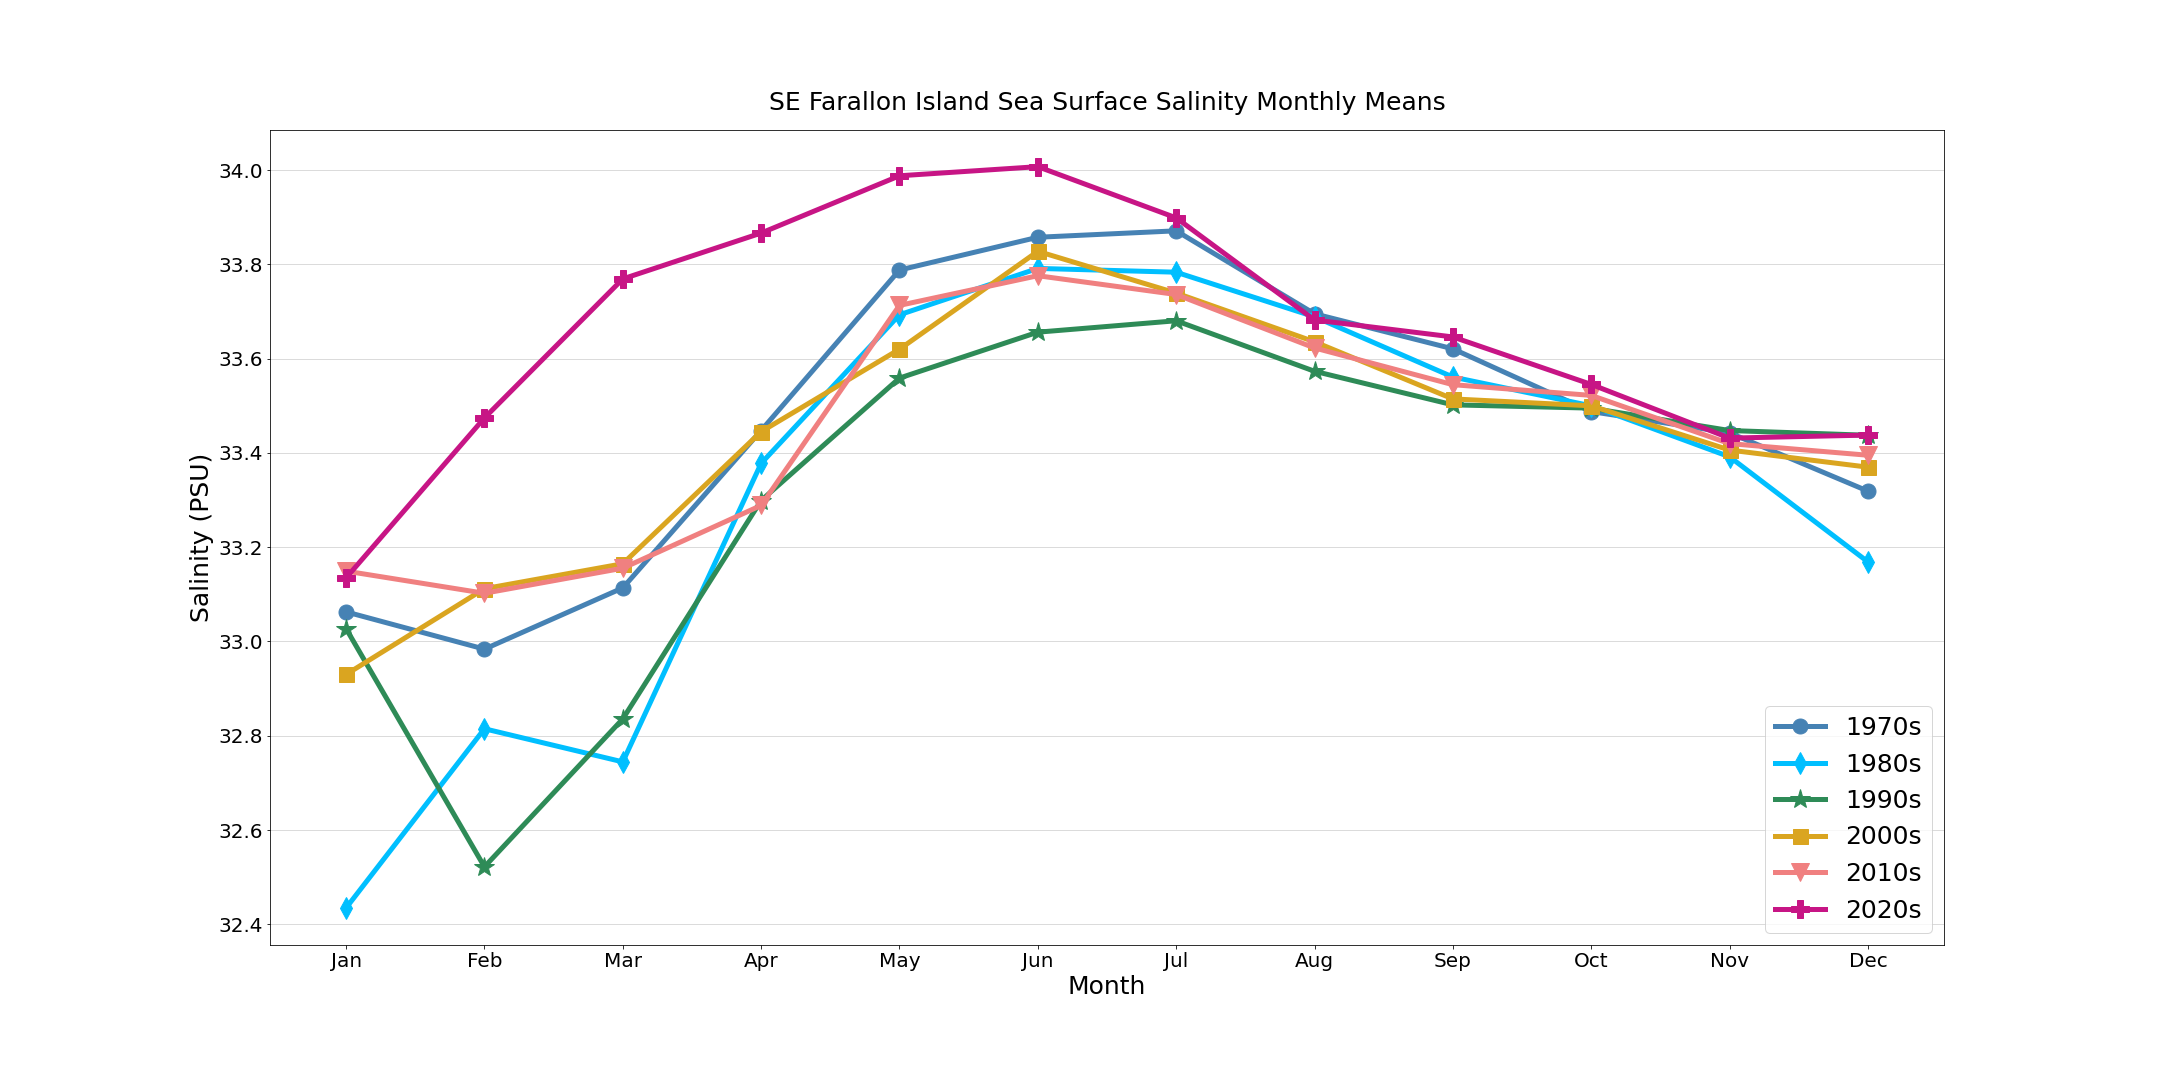
Below you can see a plot showing Monthly Sea Surface Temperature and Salinity Averages from the SE Farallon Island Shore Station, split up by decade, since 1970.
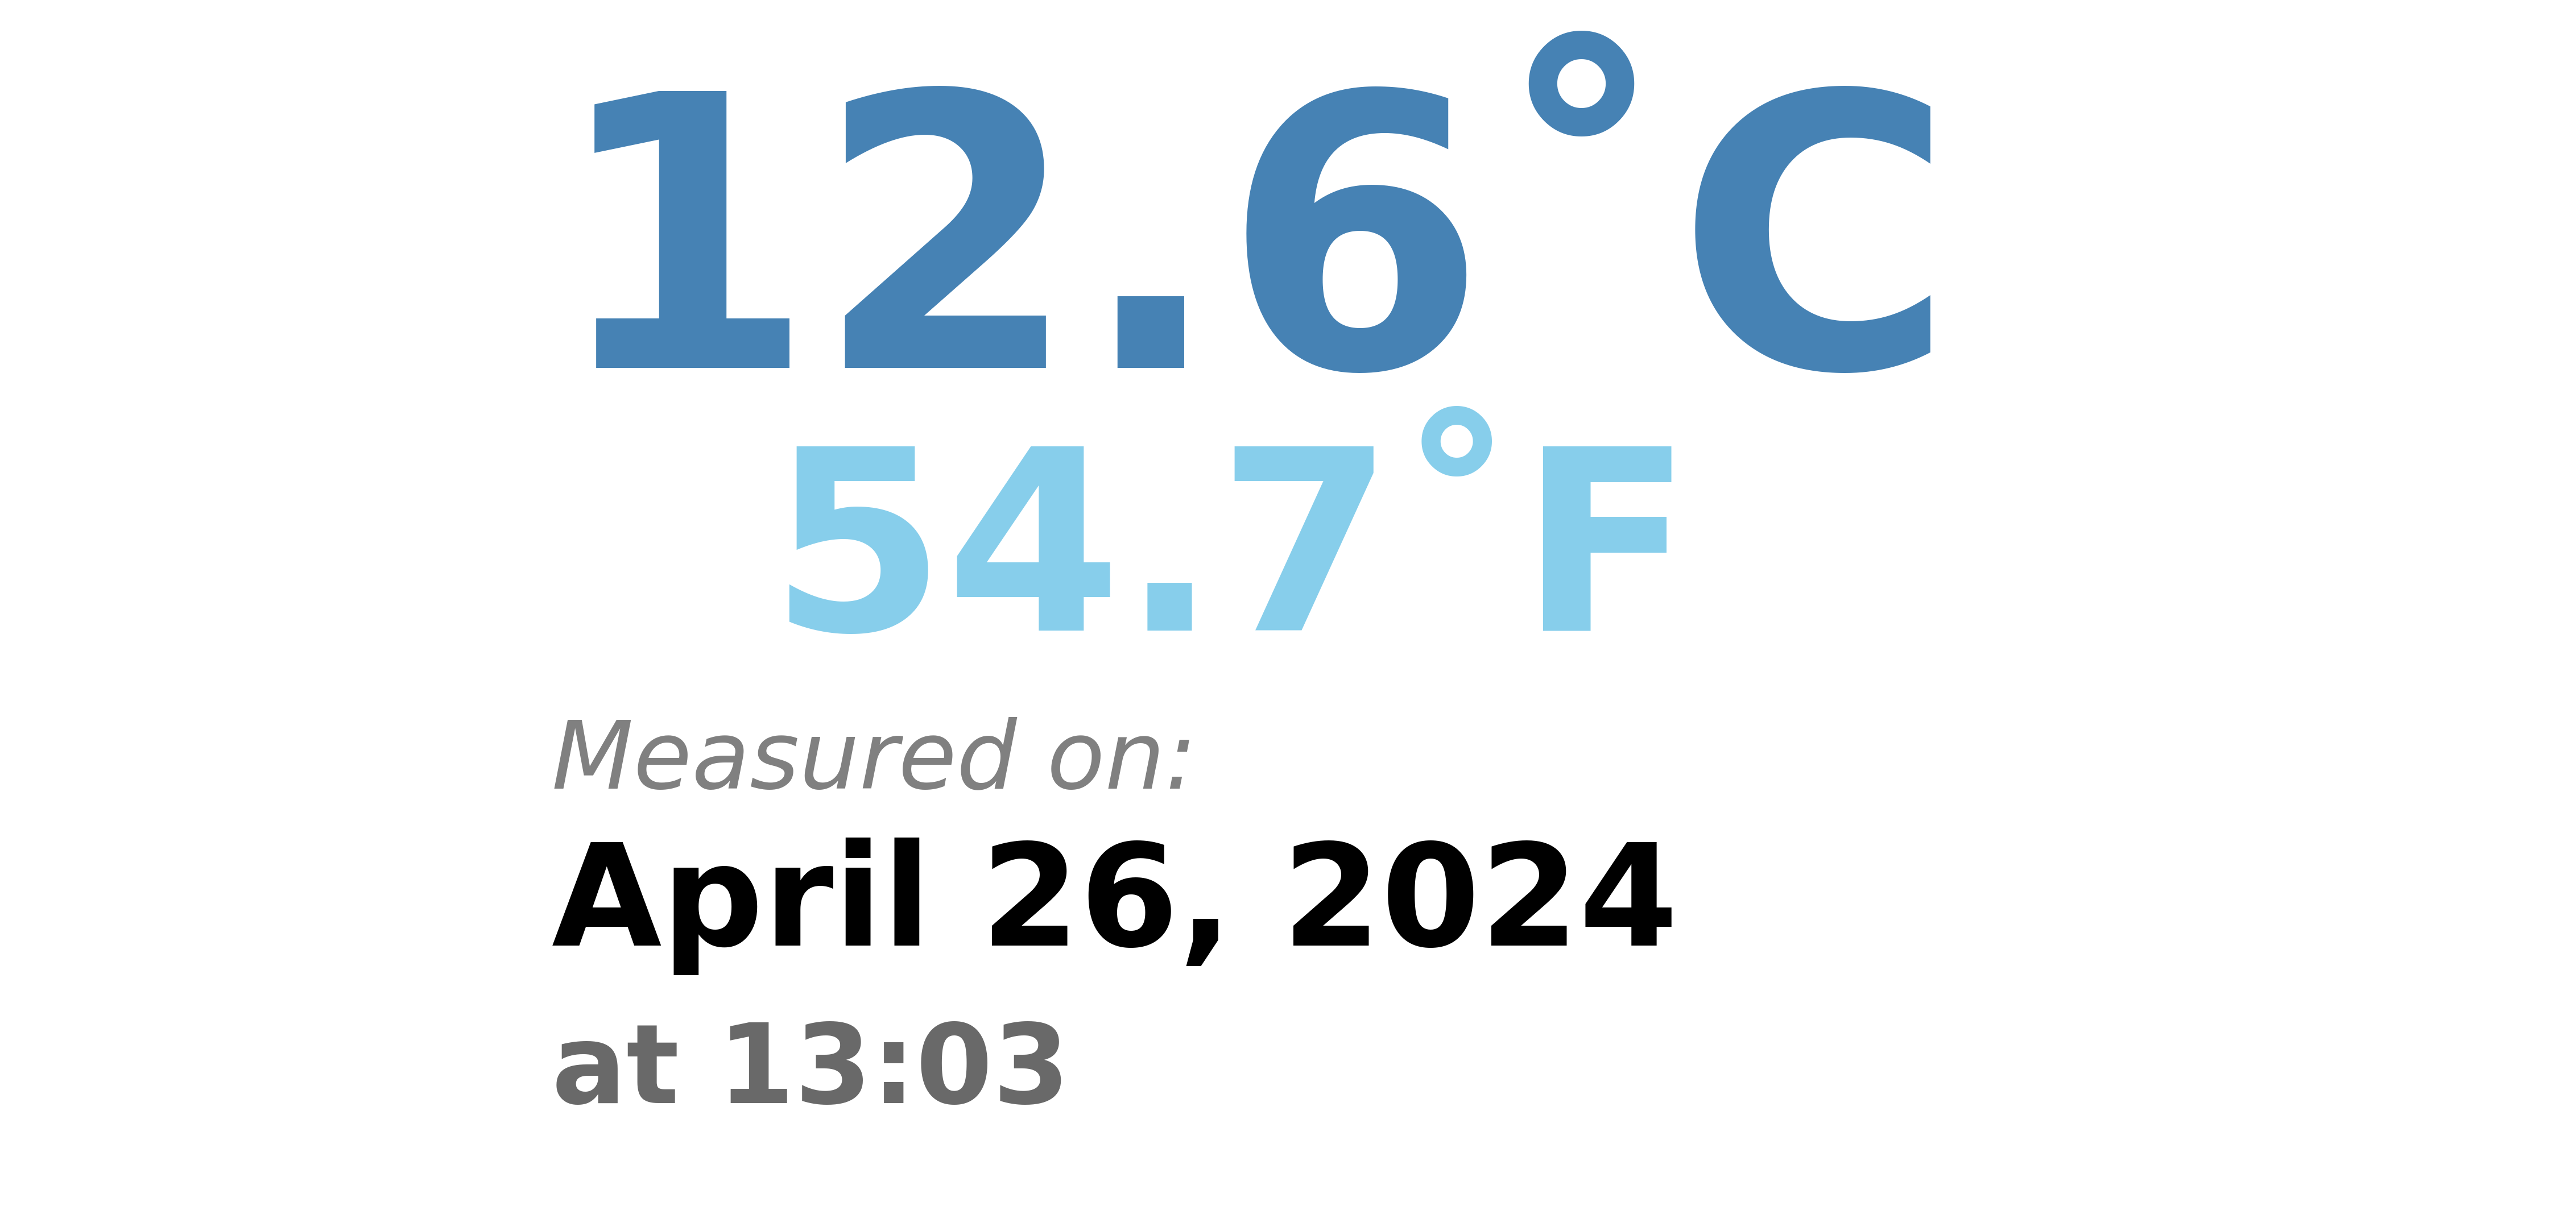
recent data