
Note: sometimes daily temperature is not taken

Total number of Shore Station samples collected at San Clemente Pier:

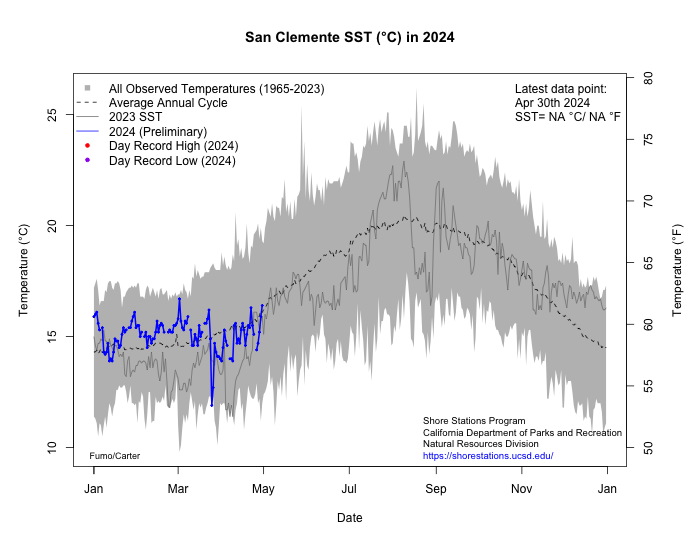
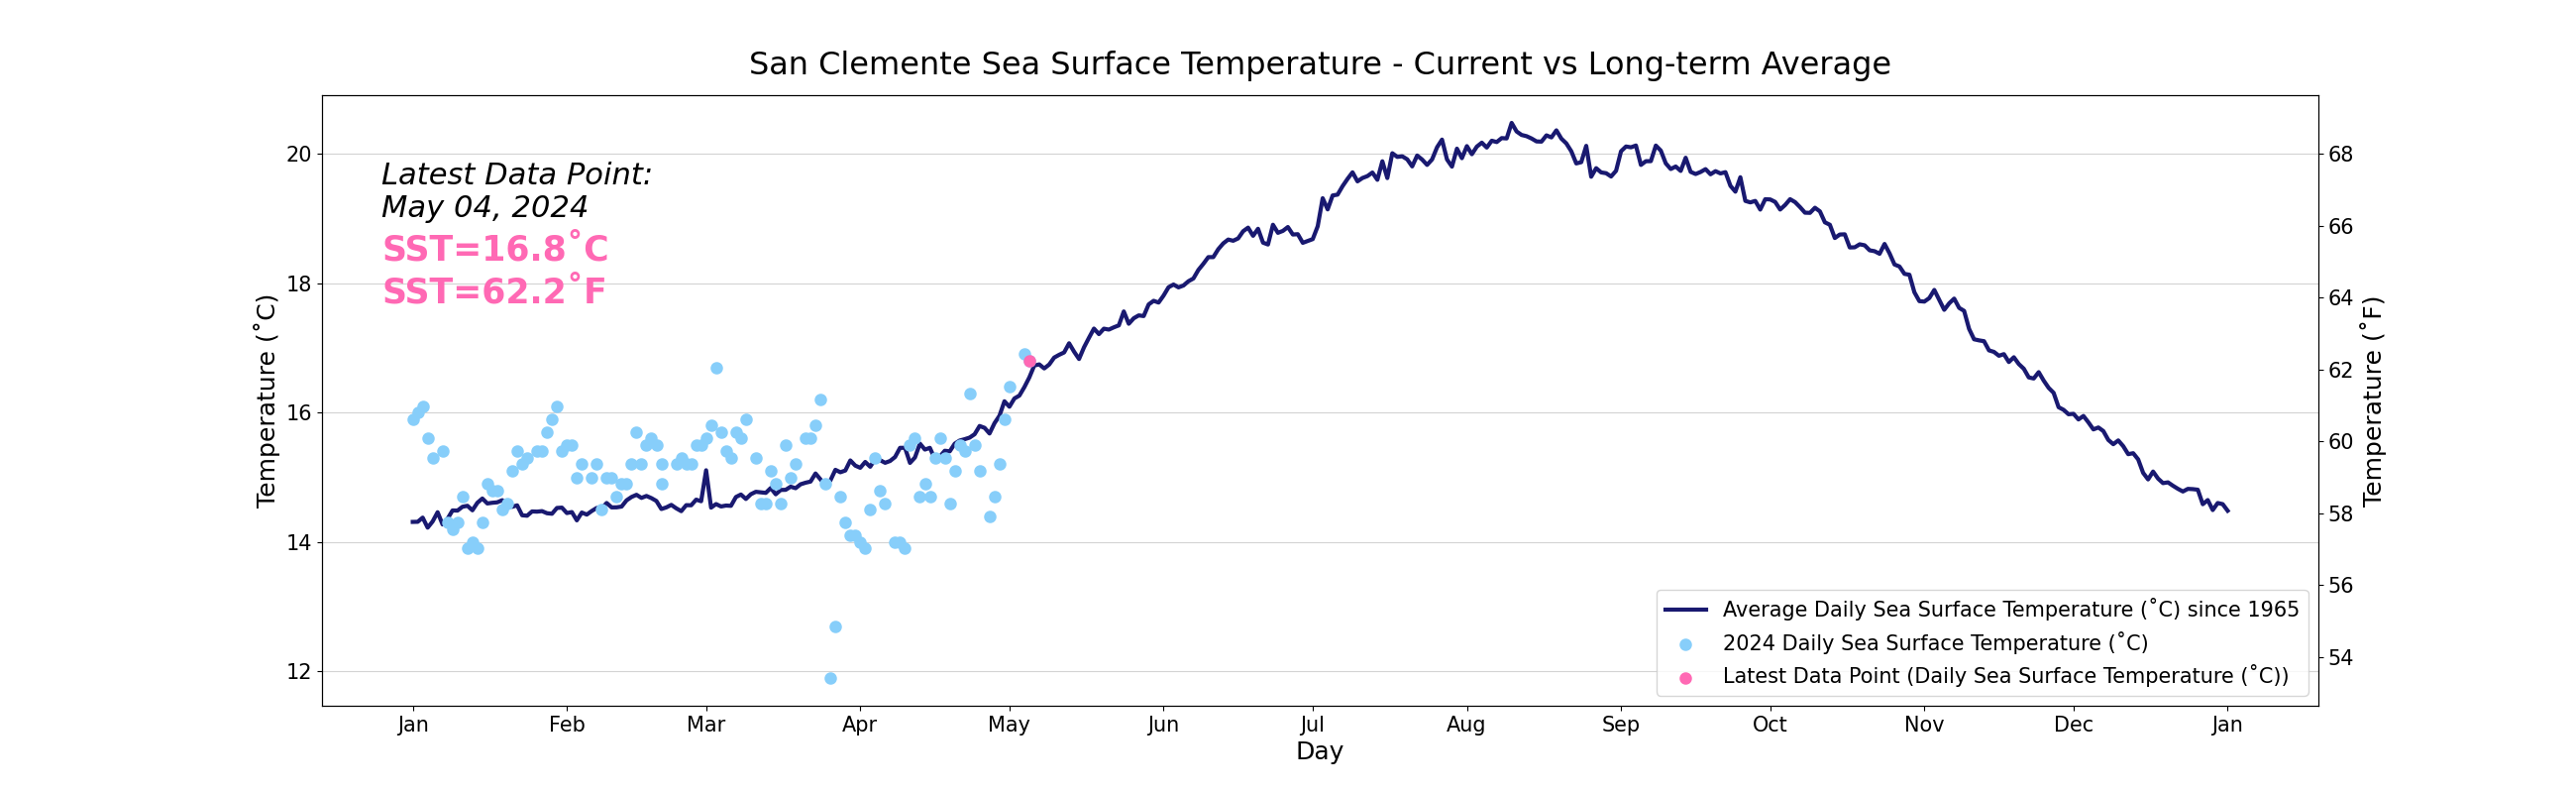
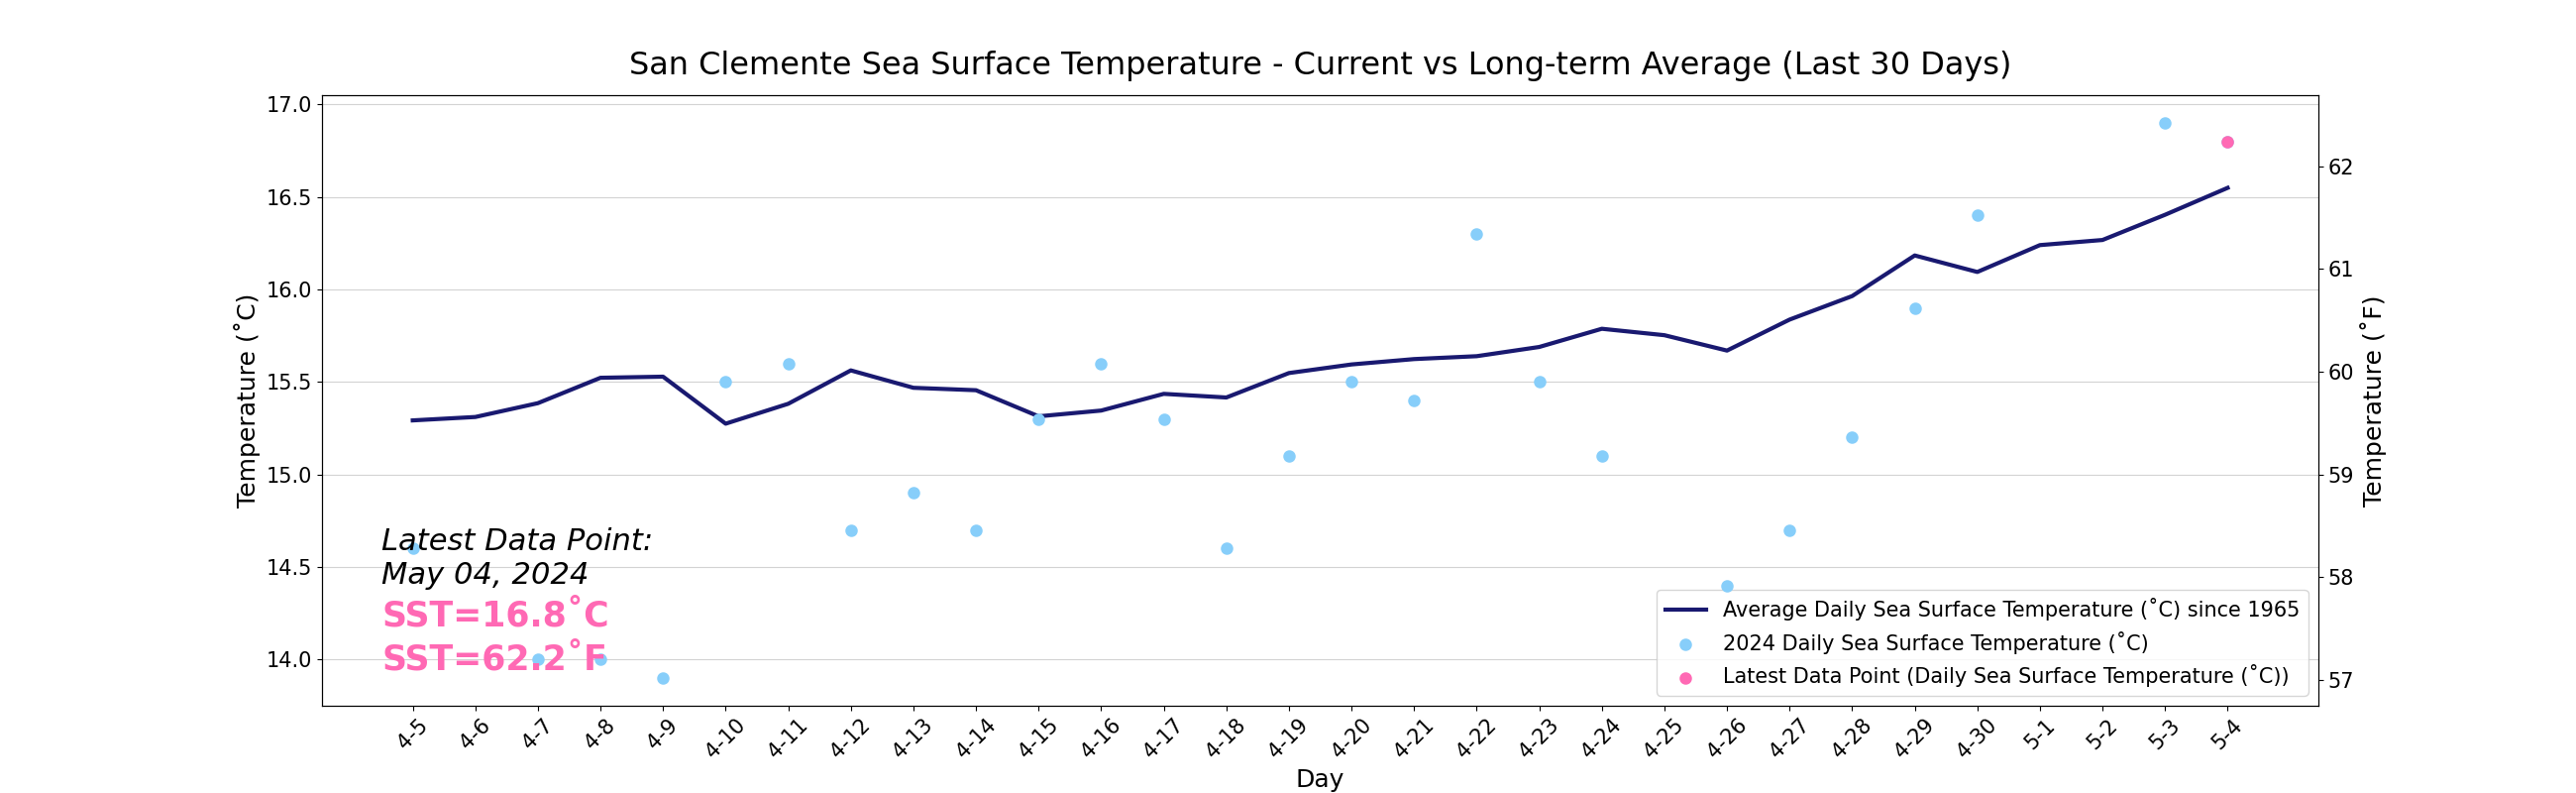
See how the daily temperature reading compares to the long term average:
Personnel of the City of San Clemente Department of Marine Safety take daily temperature and salinity samples from the San Clemente pier. Salinity samples are returned to Scripps monthly for analysis by salinometer.
Prior to 1970, sampling for this area was conducted at Dana Point (1965-1970). Because the conditions are so similar, the long record for this area has been maintained.
CLICK HERE TO ACCESS San clemente DATA FROM 1965-CURRENT
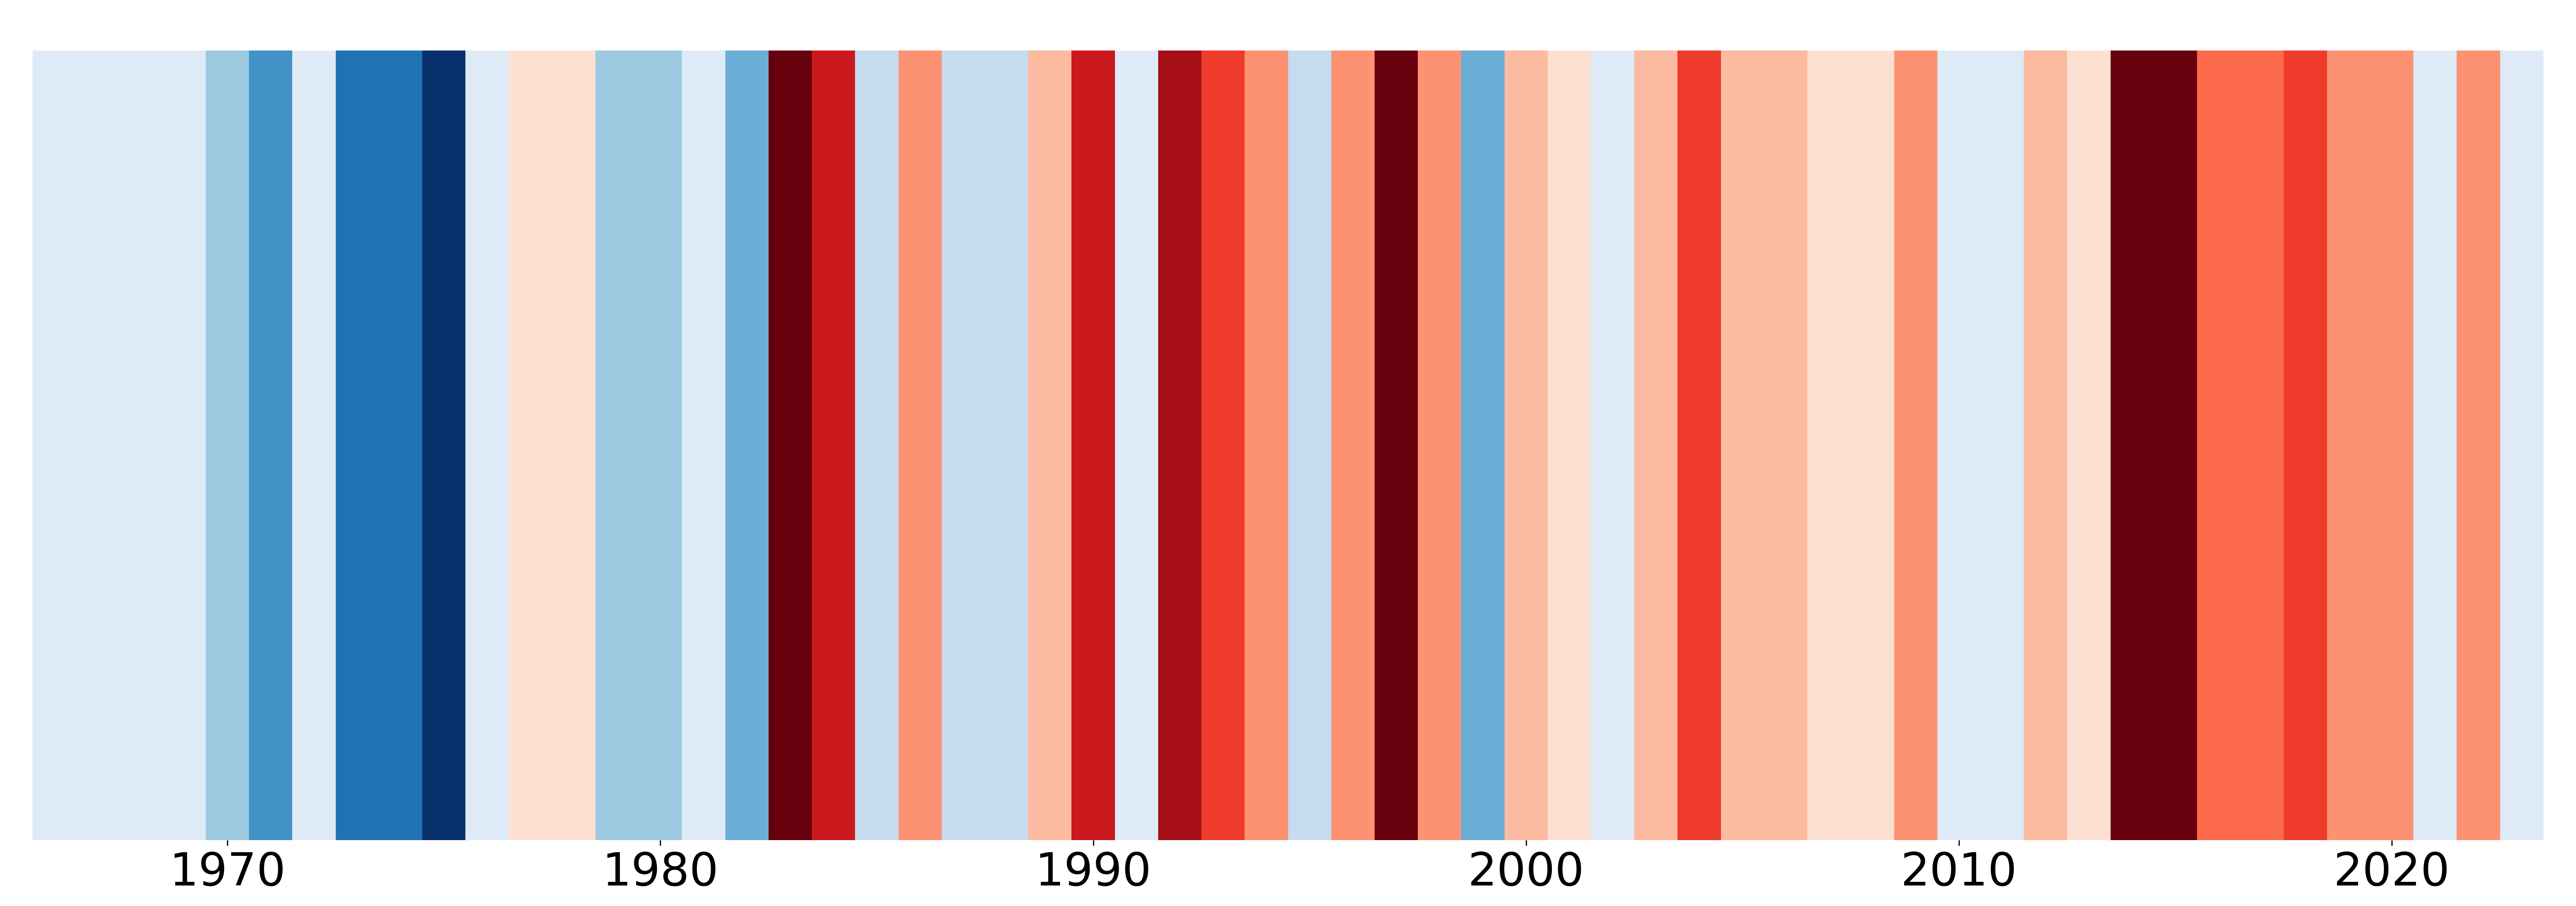
Below are figures that we have modeled after the #ShowYourStripes Campaign (created by Ed Hawkins), to help us visualize how sea surface temperature has changed at the San Clemente Pier since 1965. The change in temperature is relative to the average temperature calculated between 1965-2023.
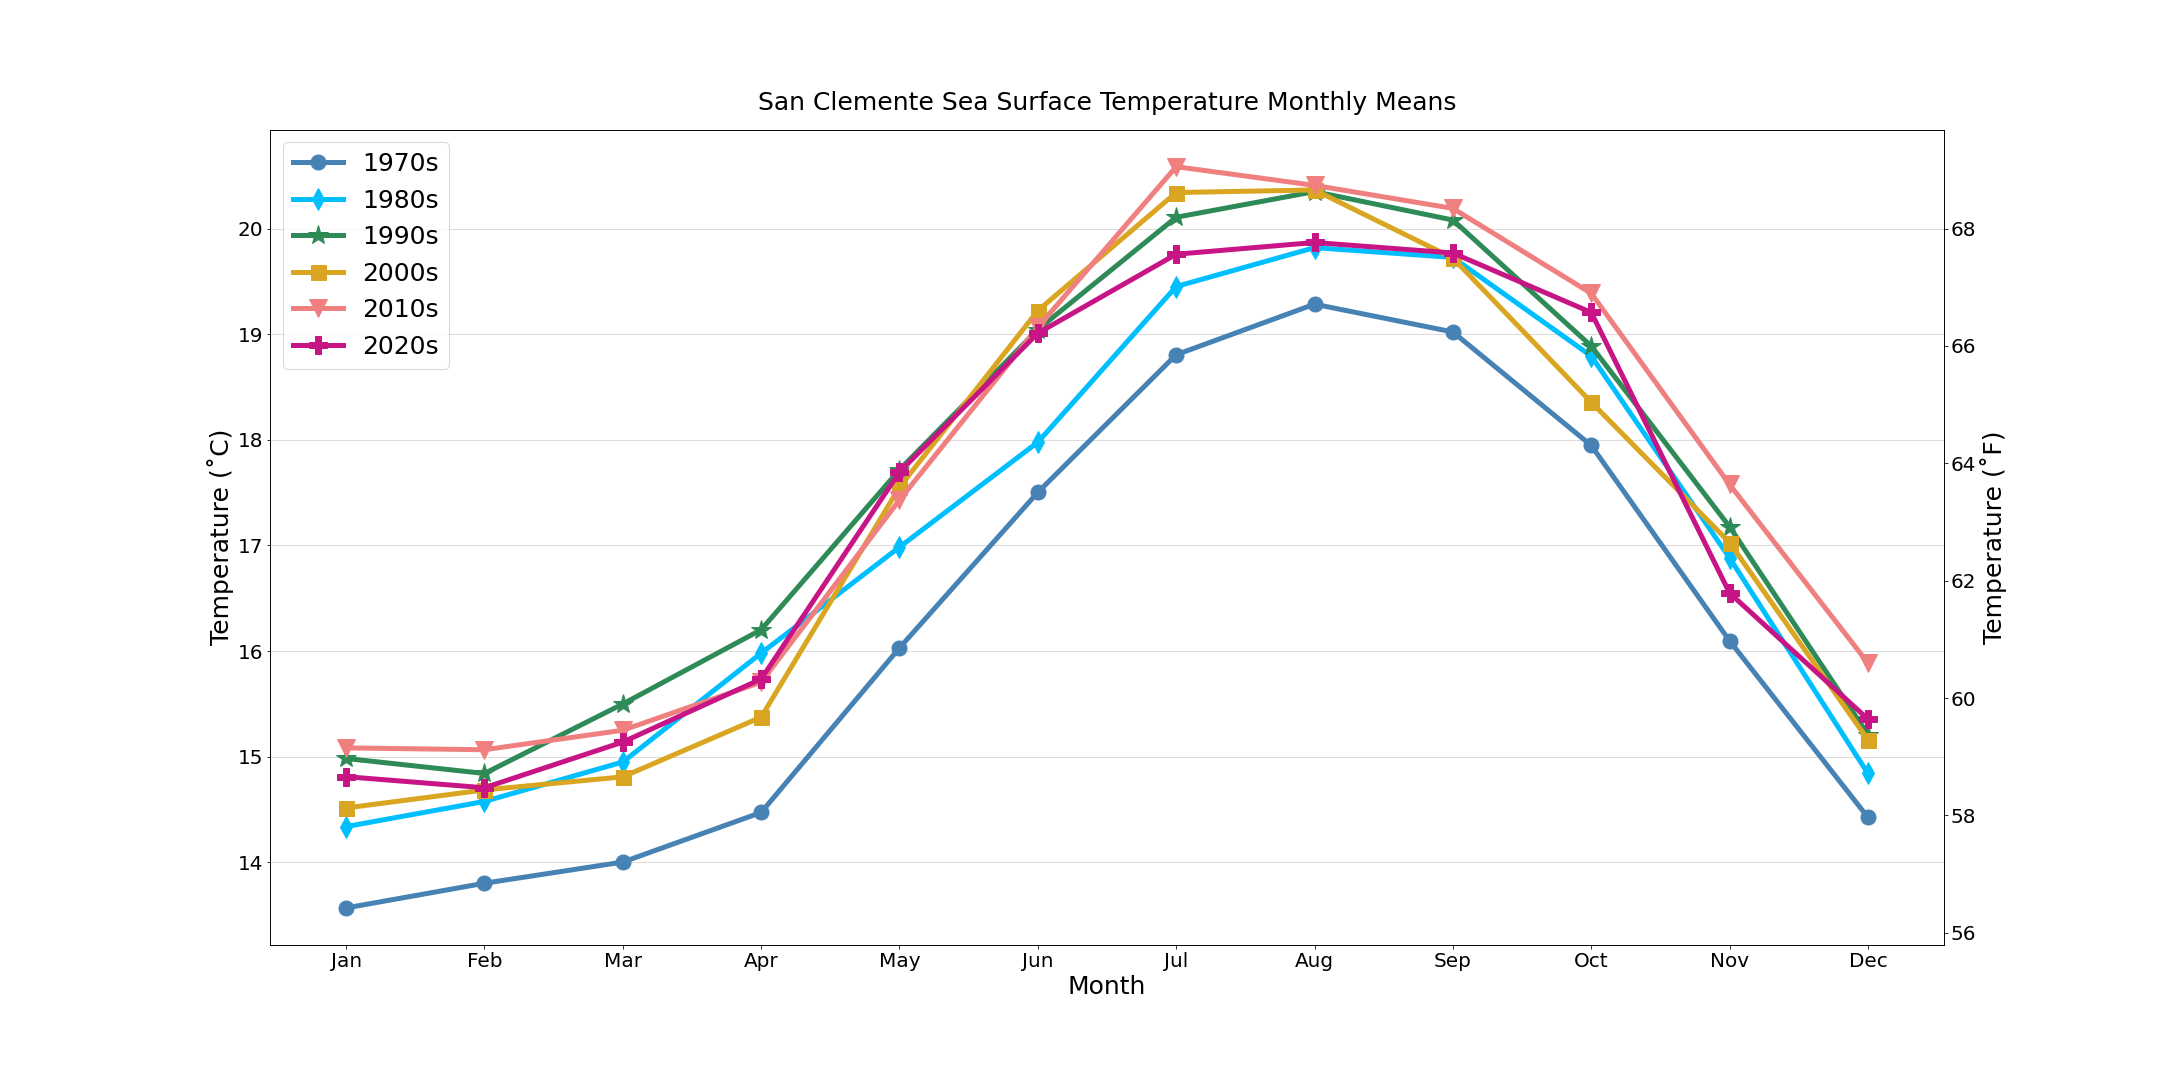
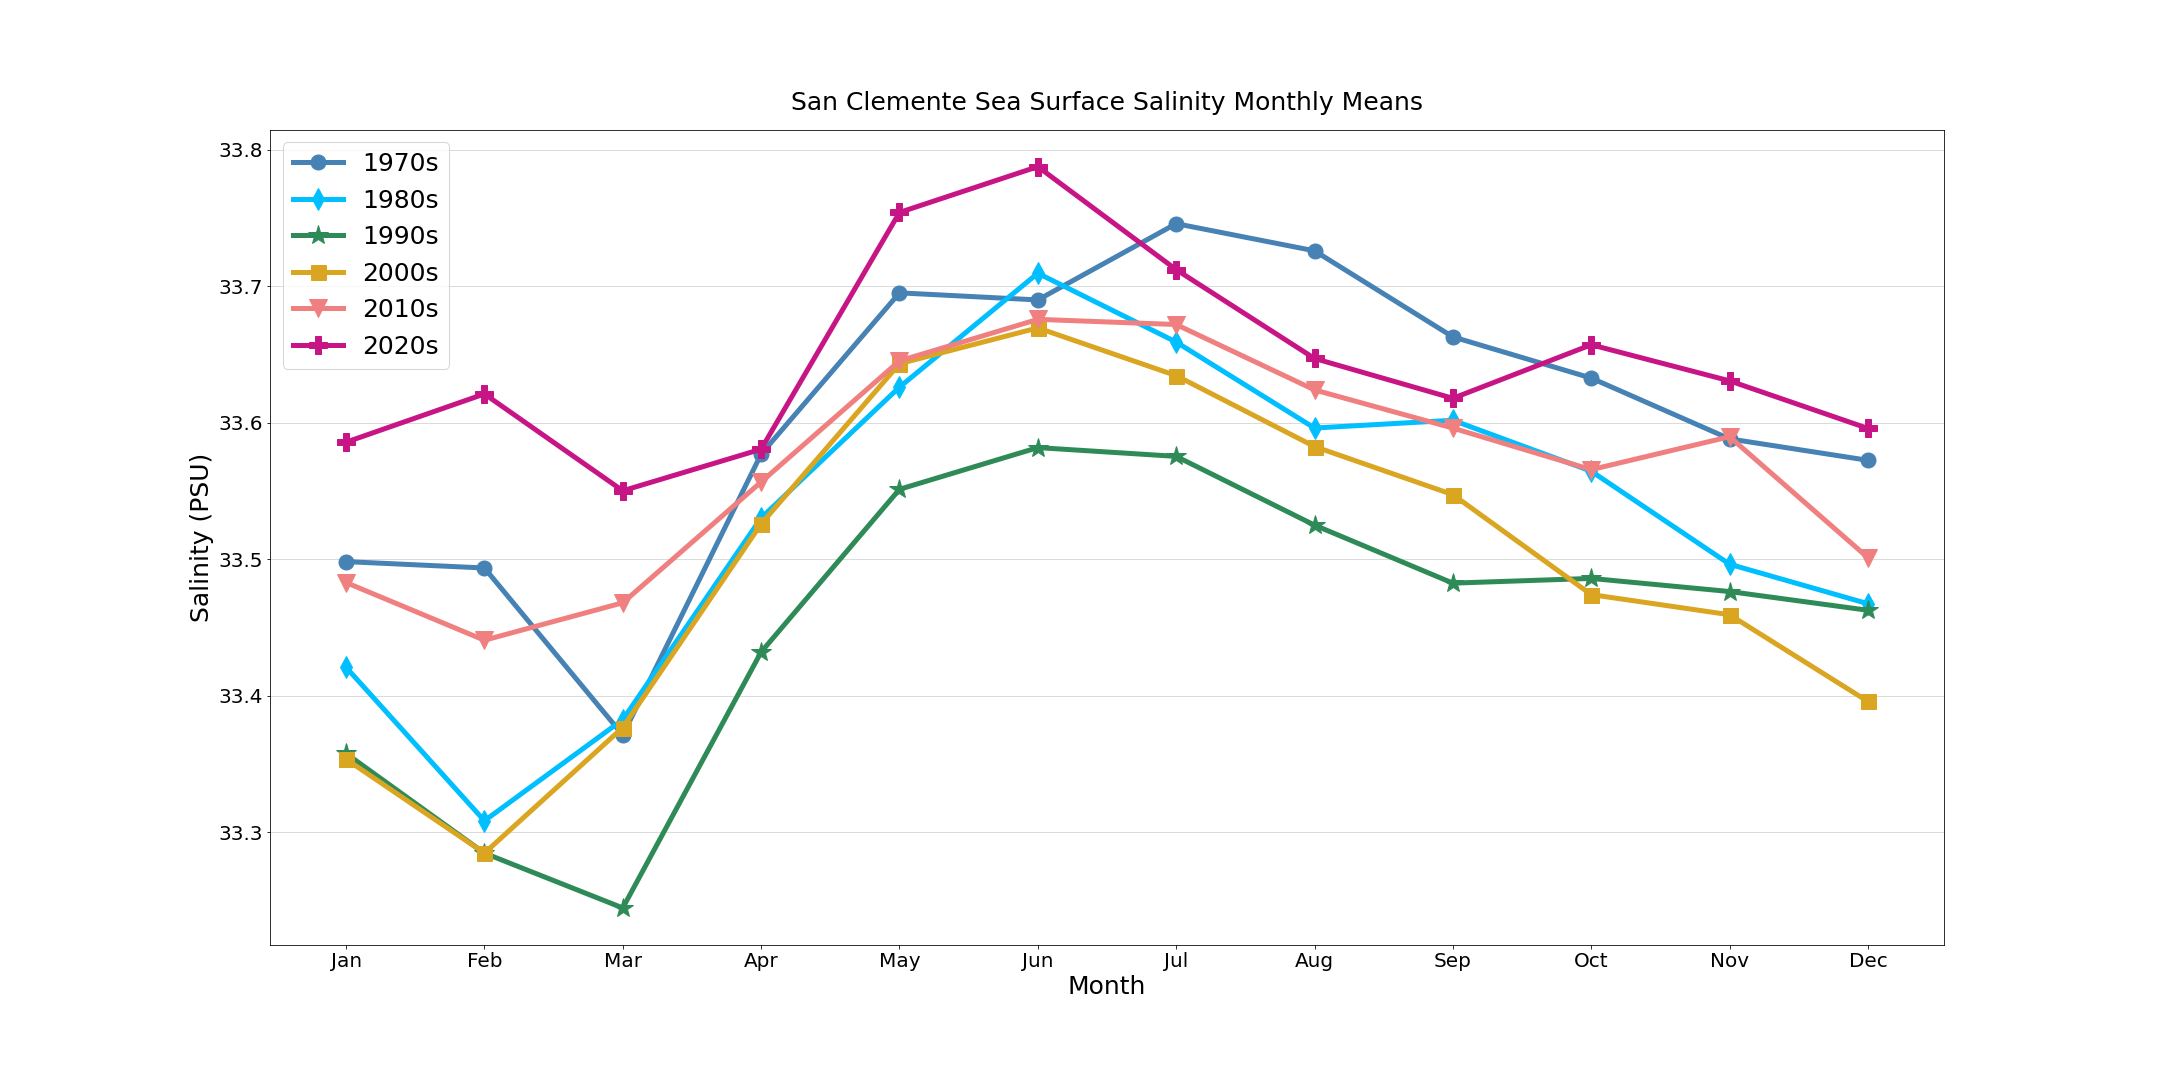
Below you can see a plot showing Monthly Sea Surface Temperature and Salinity Averages from the San Clemente Shore Station, split up by decade, since 1970.
Recent Data