Note: sometimes the daily temperature reading is not taken

Total number of Shore Station samples collected at Santa Barbara Harbor:

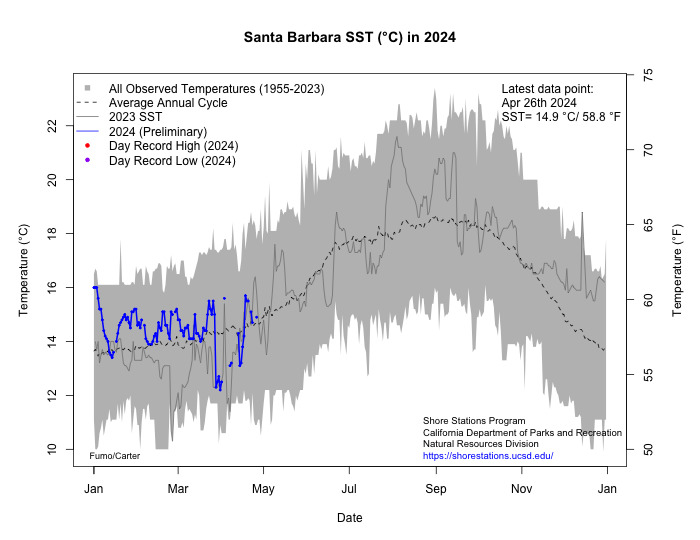
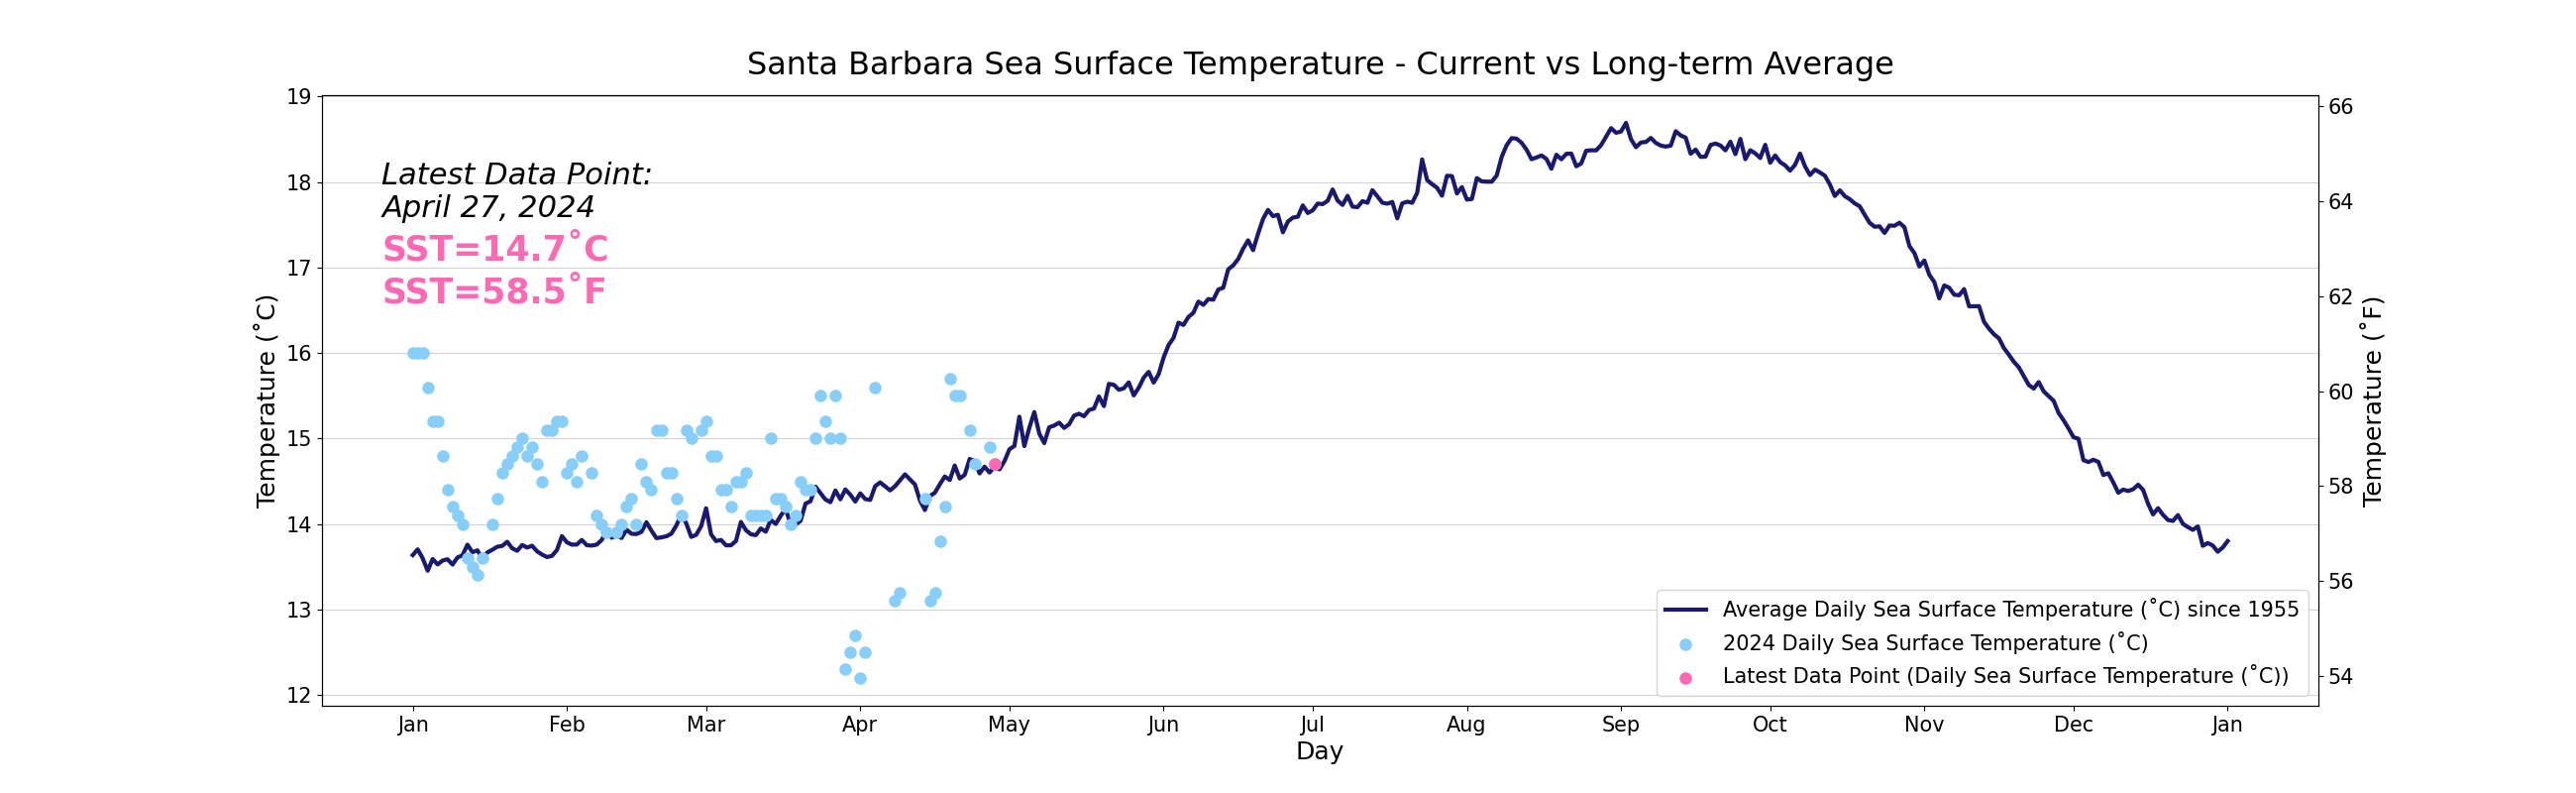
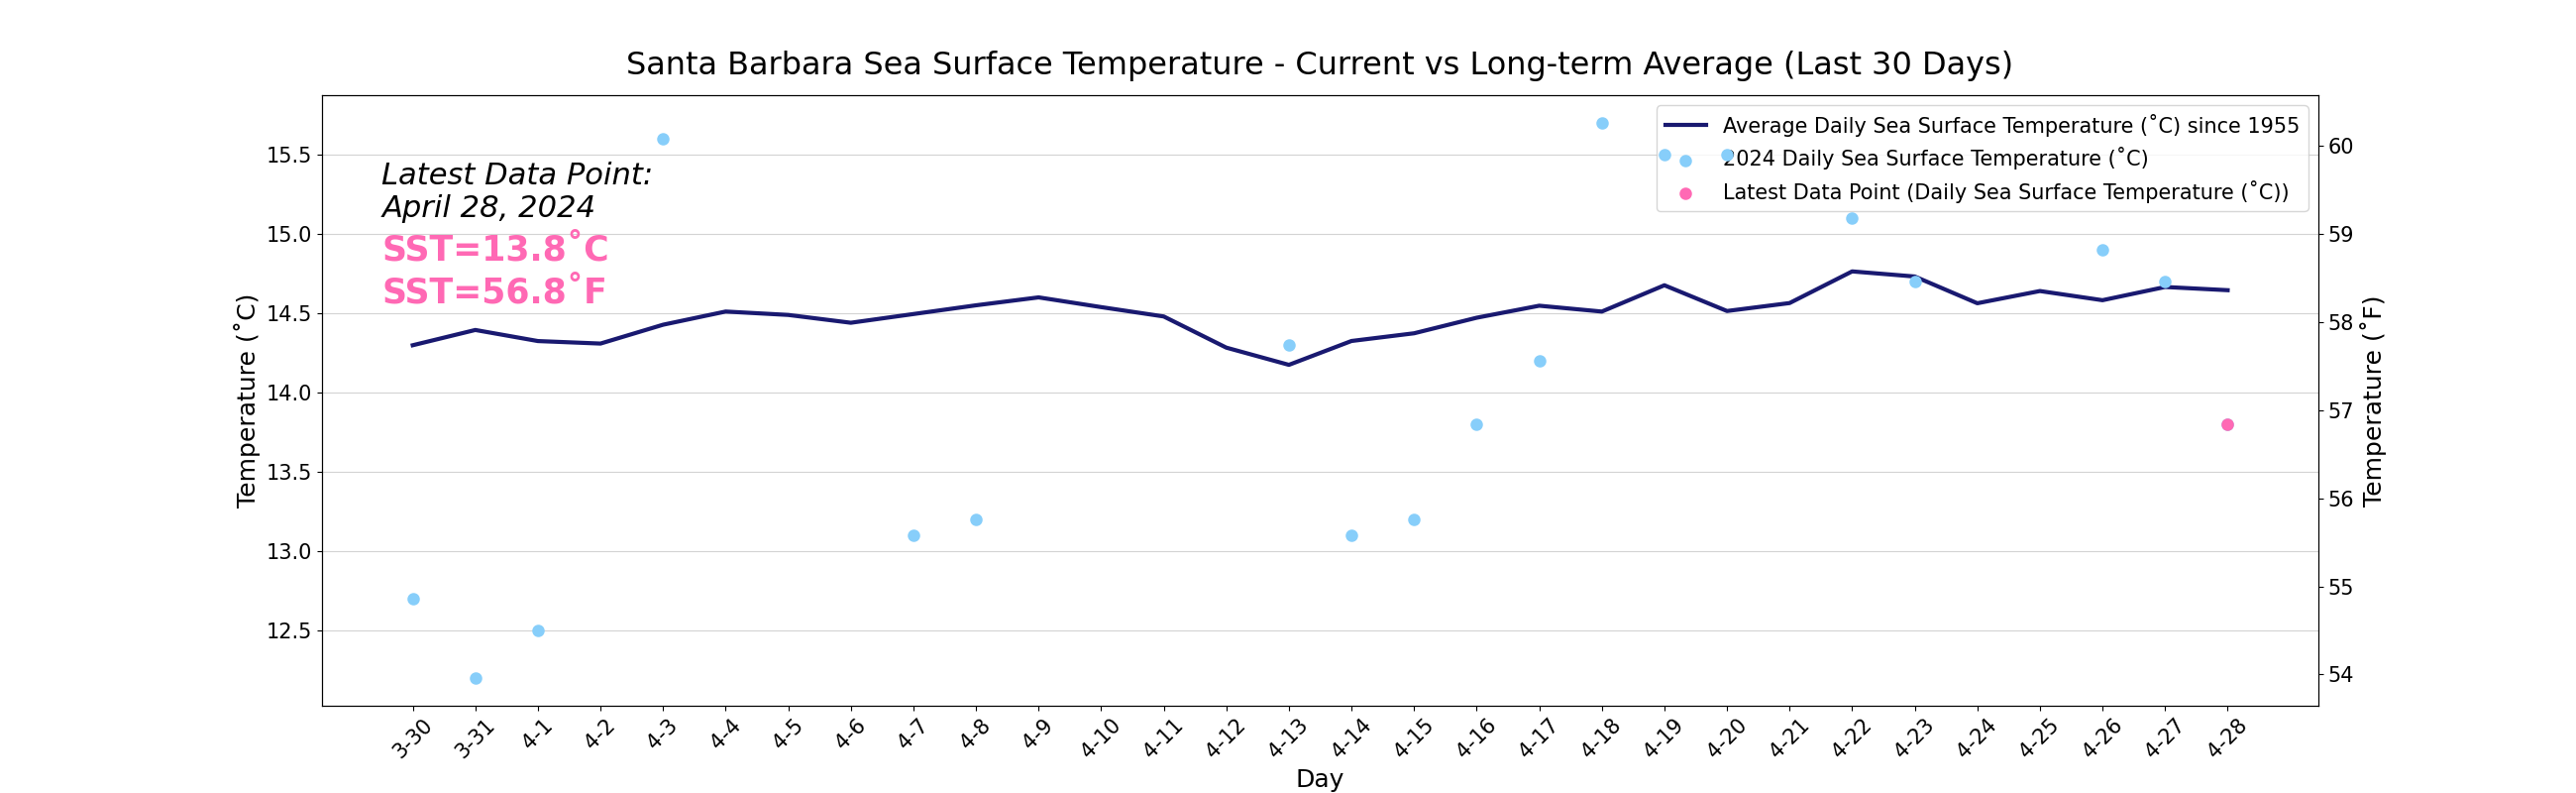
See how the daily temperature reading compares to the long term average:

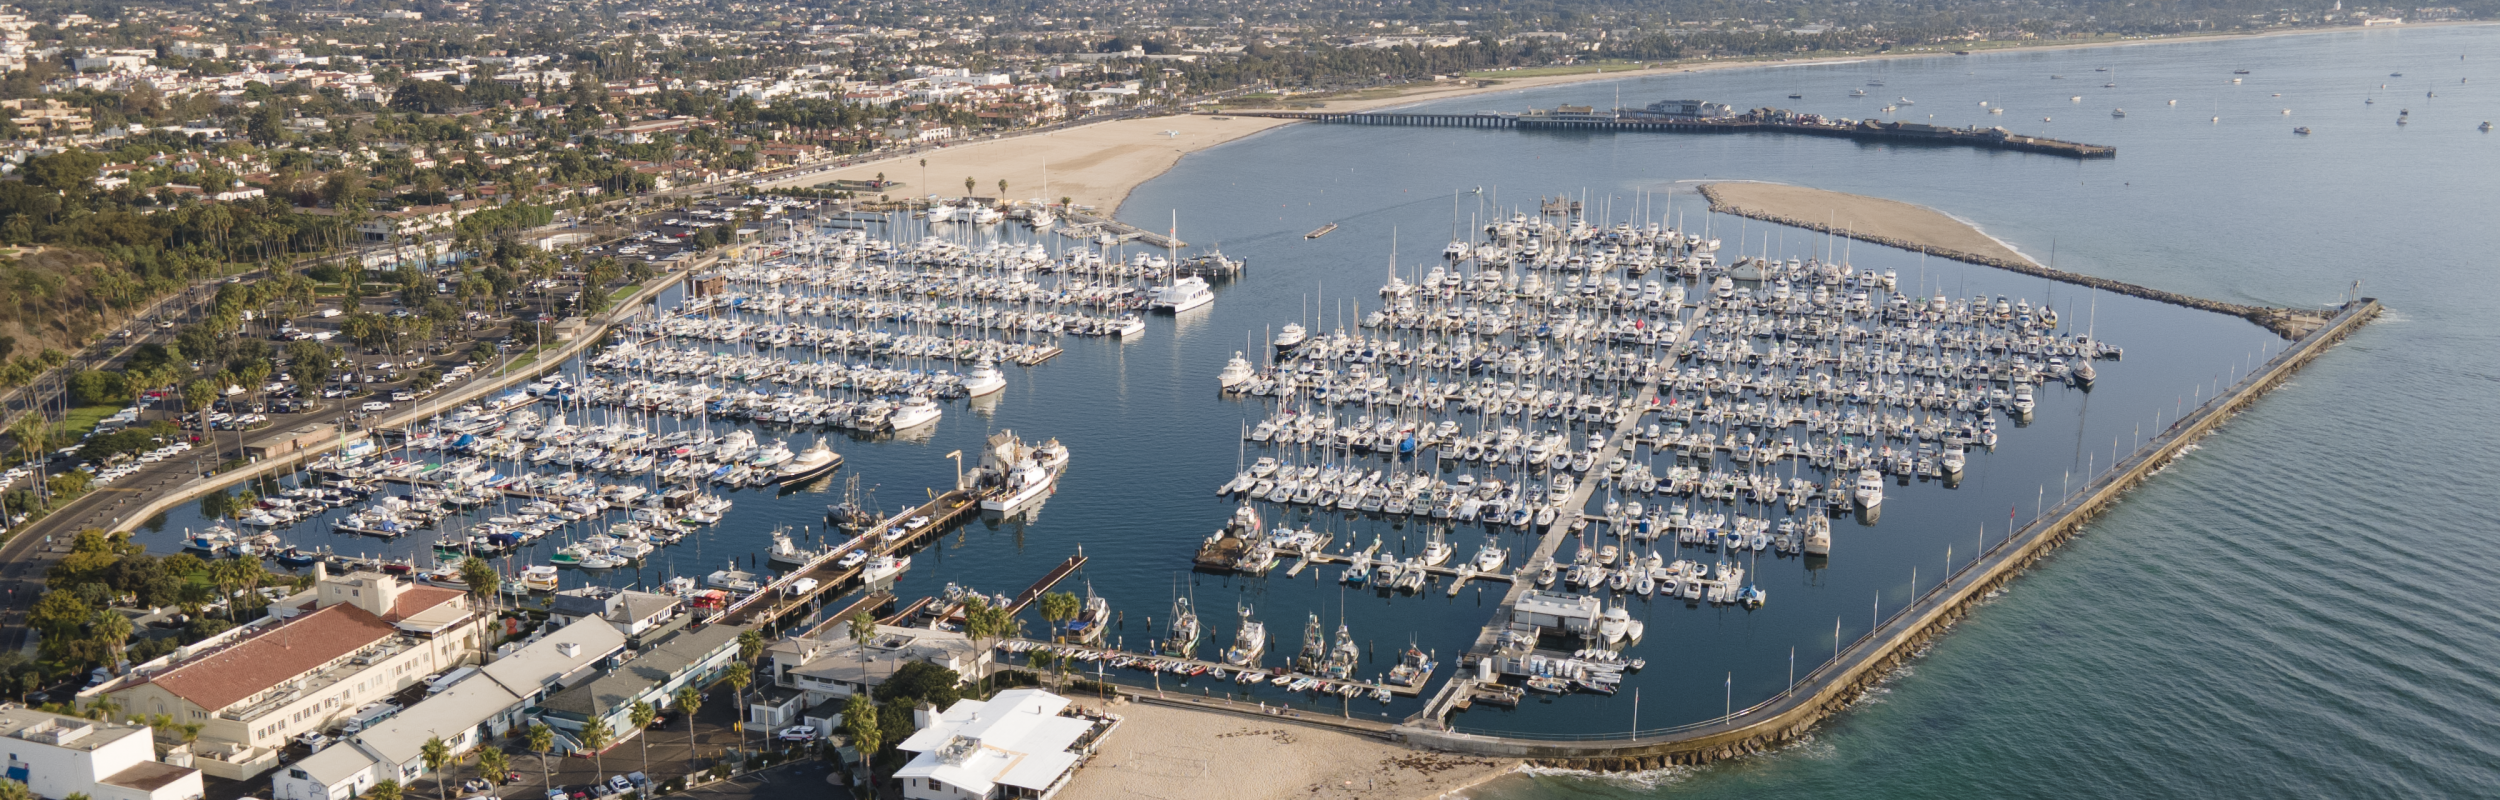
Each morning Santa Barbara Harbor Patrol personnel record the surface water temperature from their boat dock at the west end of the harbor.
Exchange from tidal circulation in the harbor is high, and the sample is taken before solar warming is evident (early in the morning, usually before sunrise), so the recorded temperatures should be representative of coastal waters.
Click here to access Santa Barbara data from 1955-current
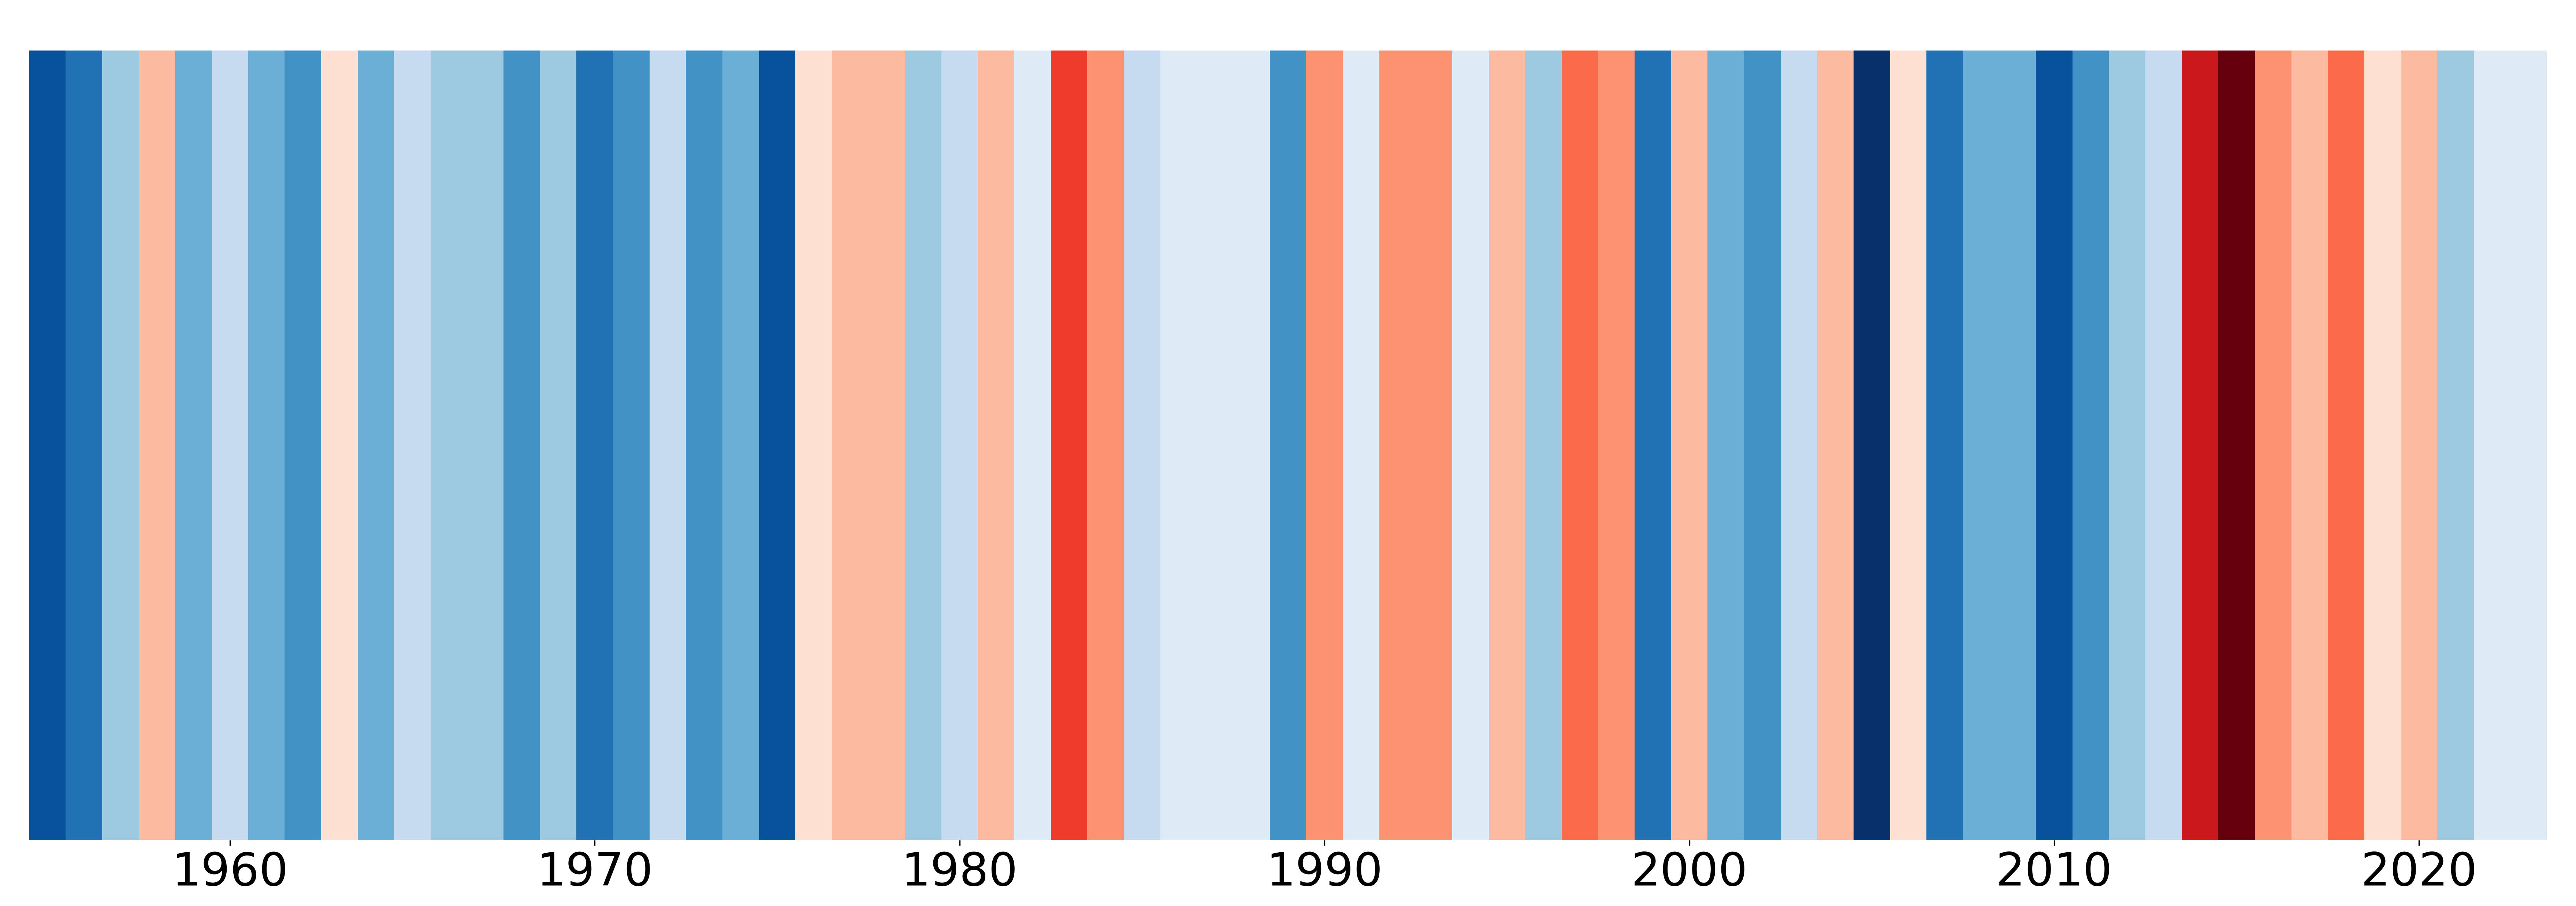
Below are figures that we have modeled after the #ShowYourStripes Campaign (created by Ed Hawkins), to help us visualize how sea surface temperature has changed in the Santa Barbara Harbor since 1955. The change in temperature is relative to the average temperature calculated between 1955-2023.
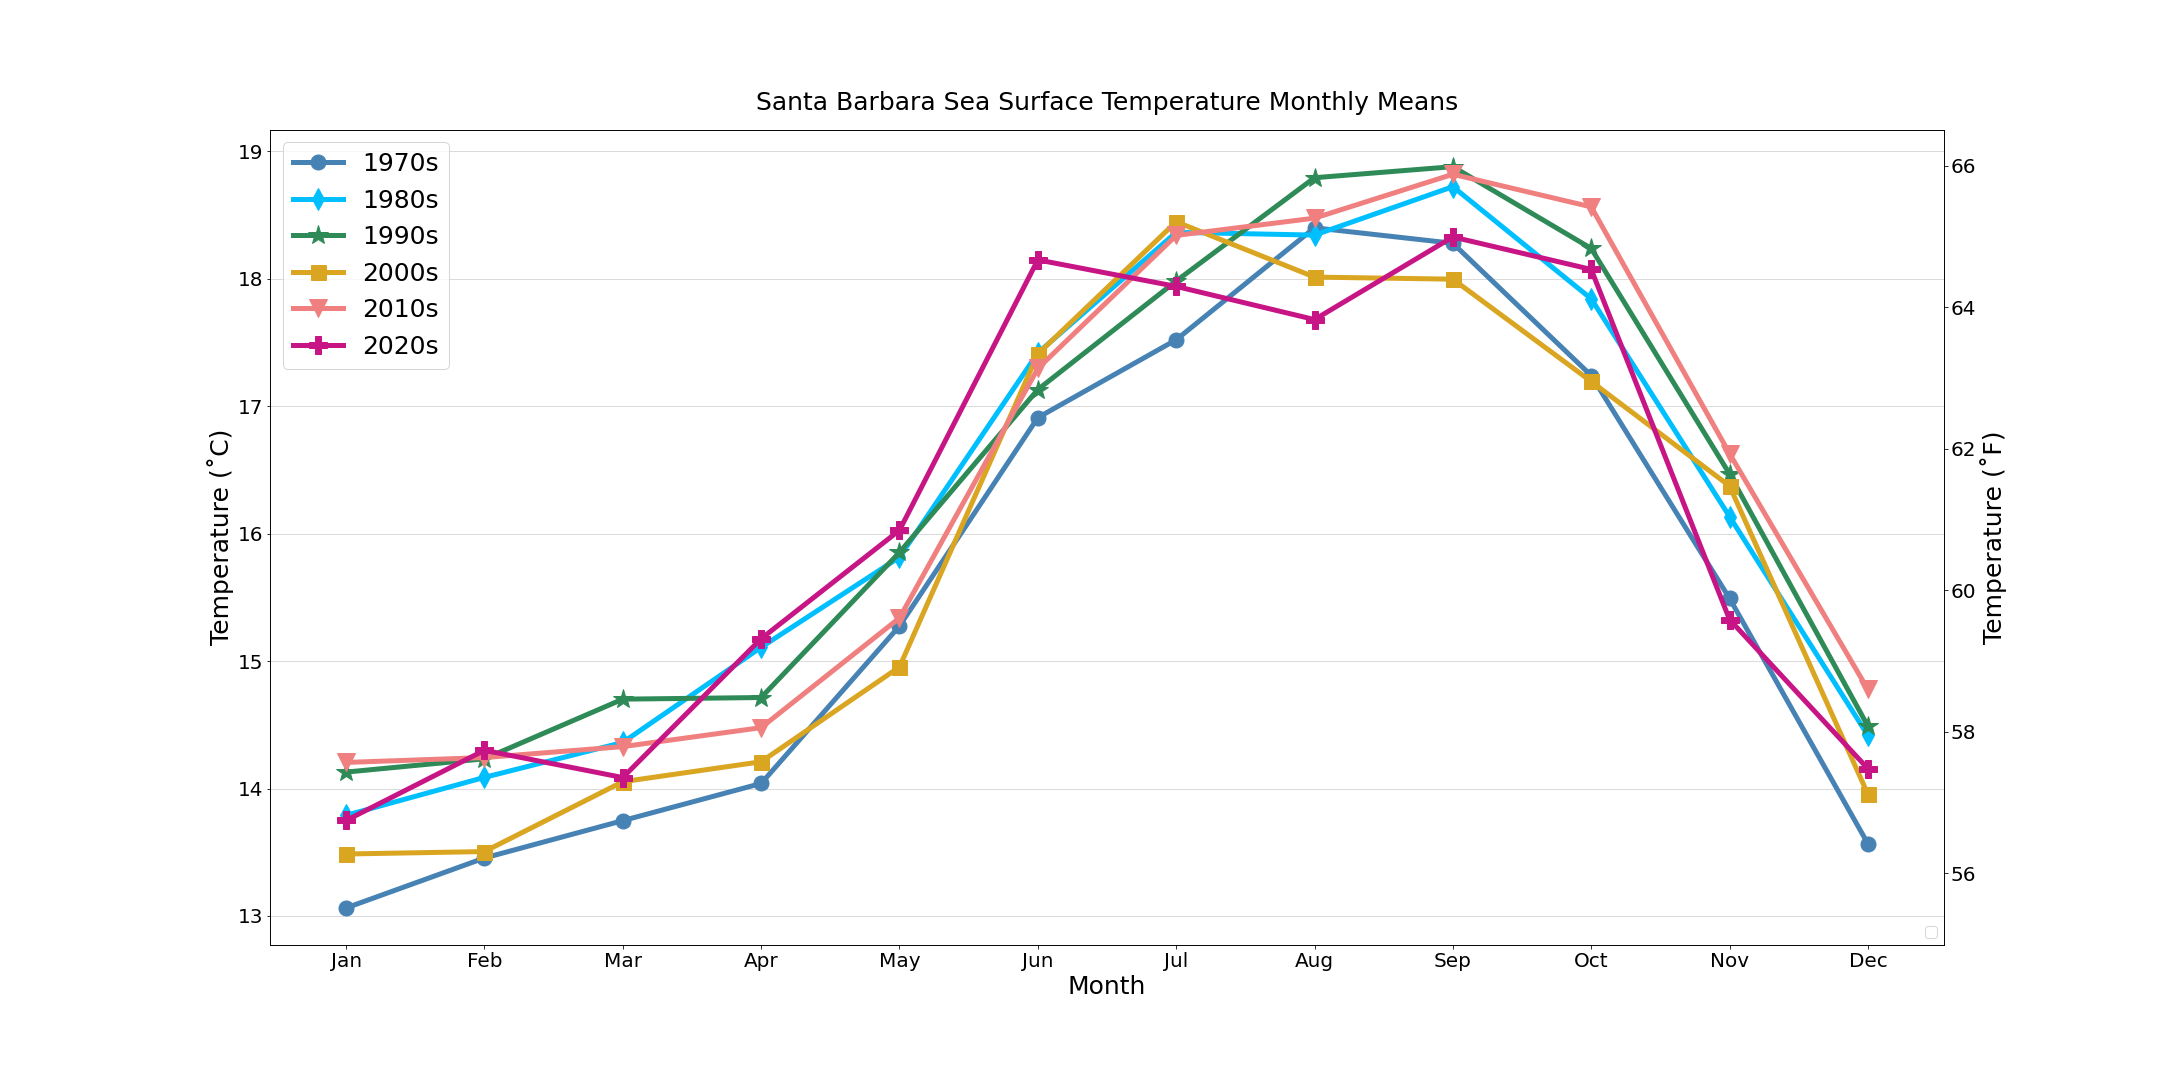
Below you can see a plot showing Monthly Sea Surface Temperature Averages from the Santa Barbara Shore Station, split up by decade, since 1970.
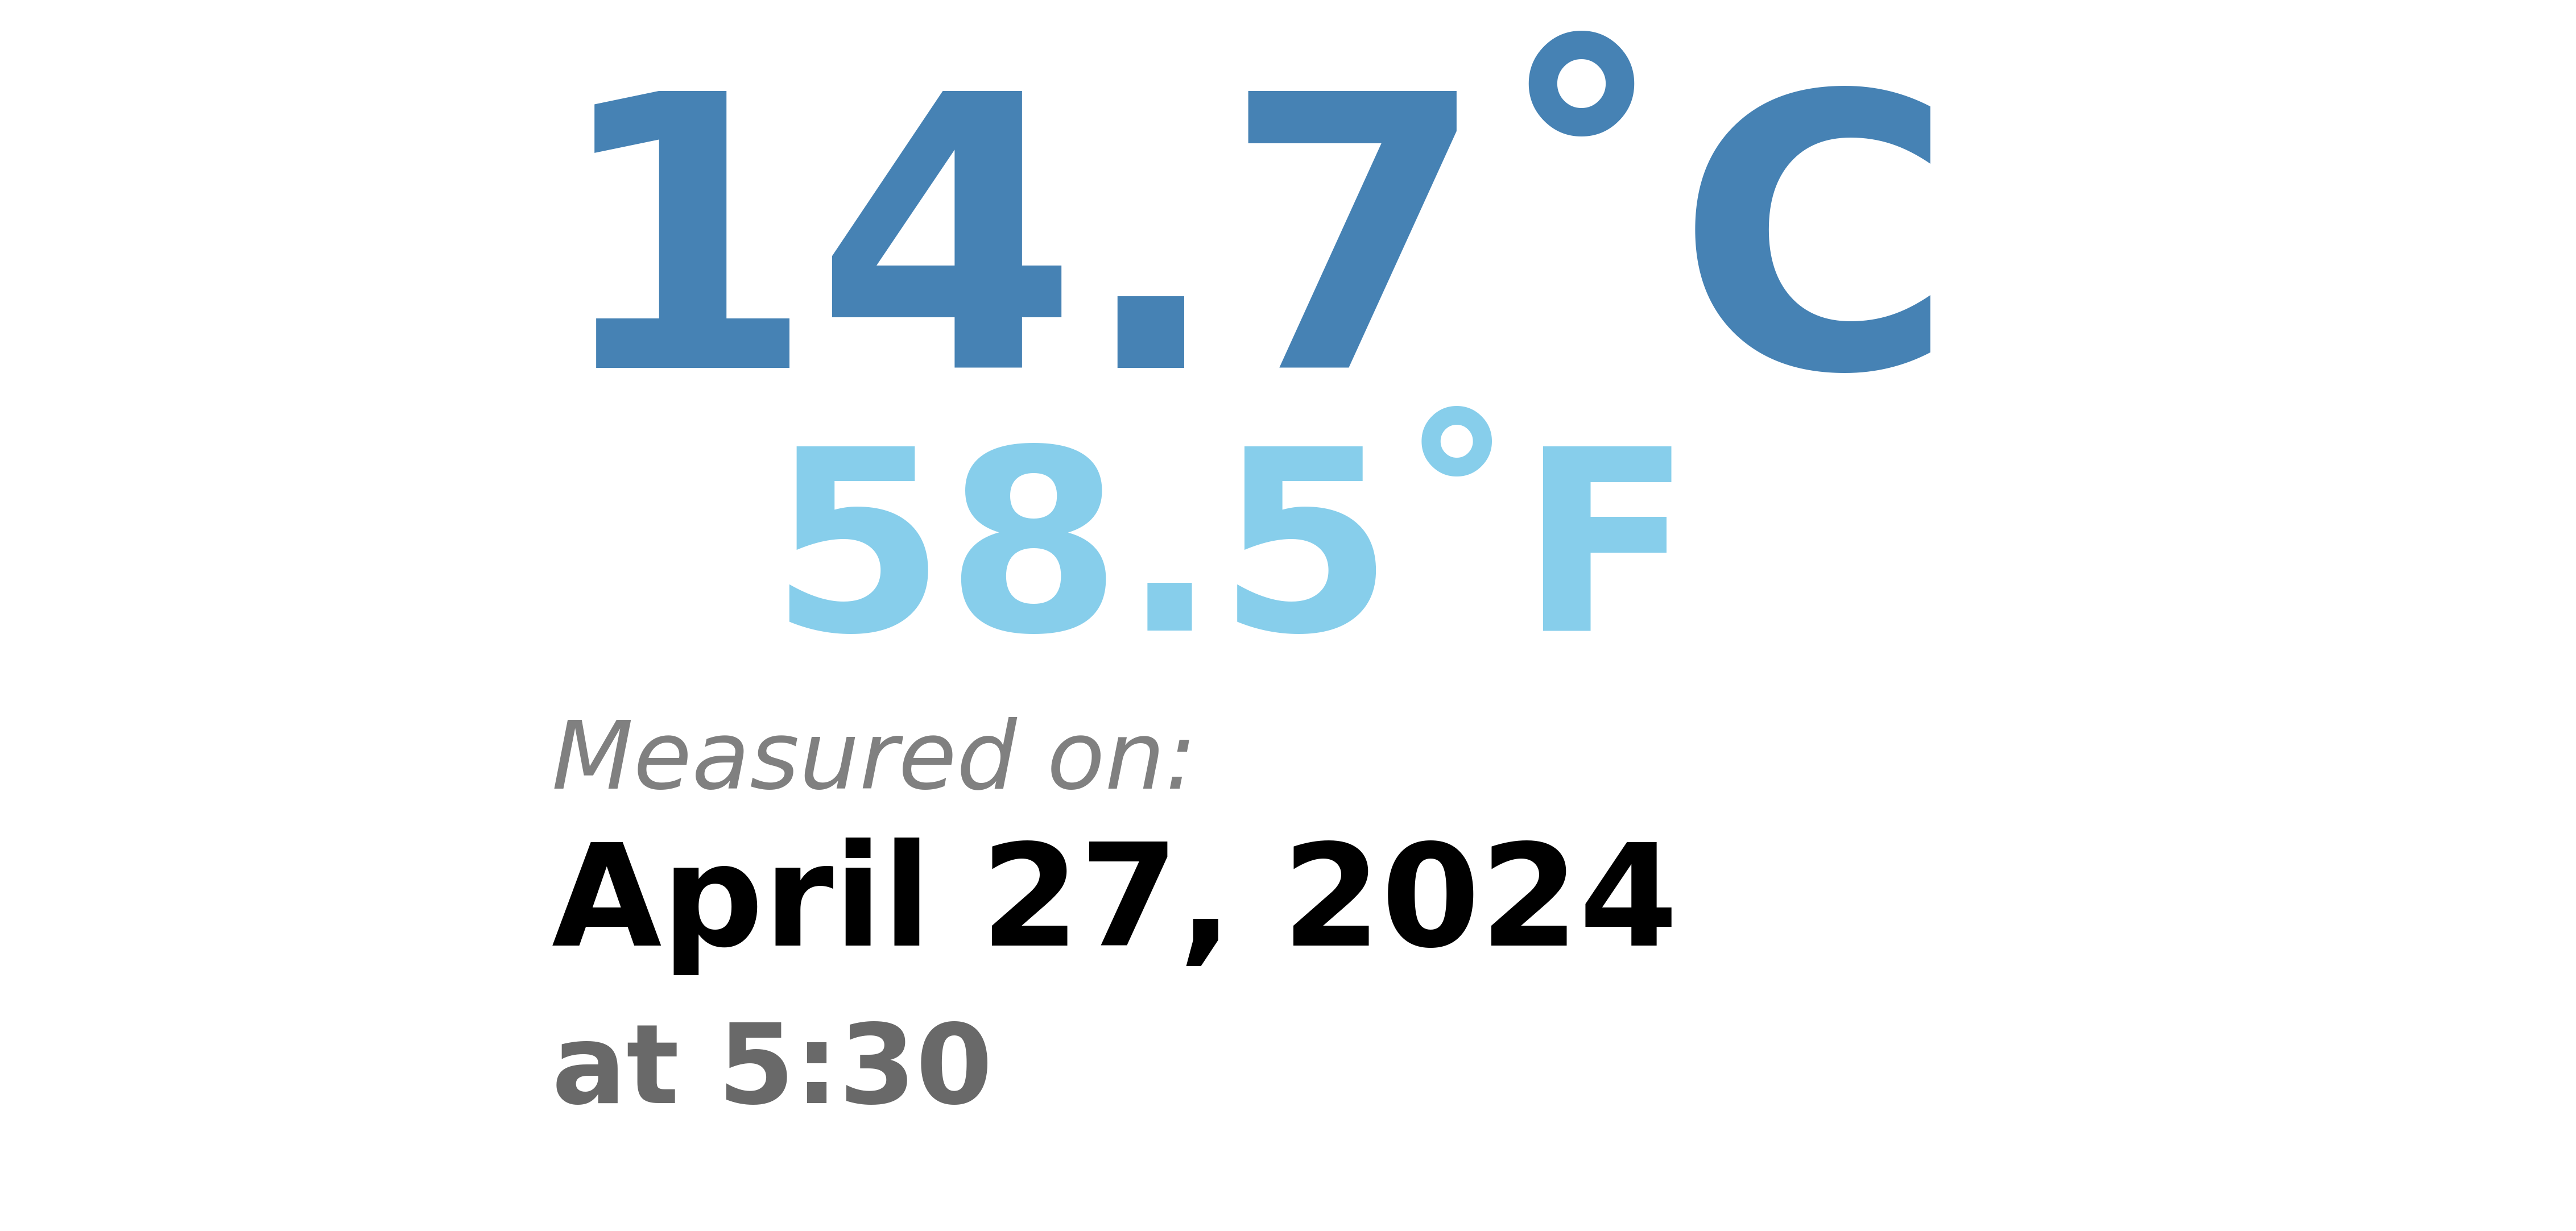
Recent data