Note: sometimes the daily temperature is not taken

Total number of Shore Station samples collected at Granite Canyon:

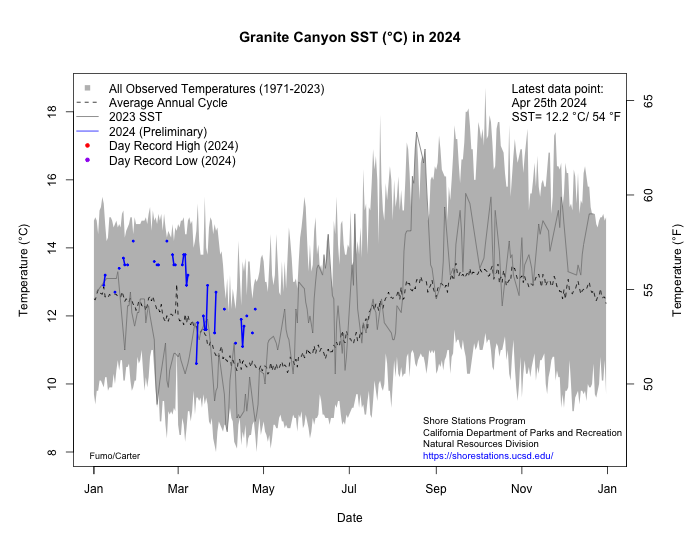
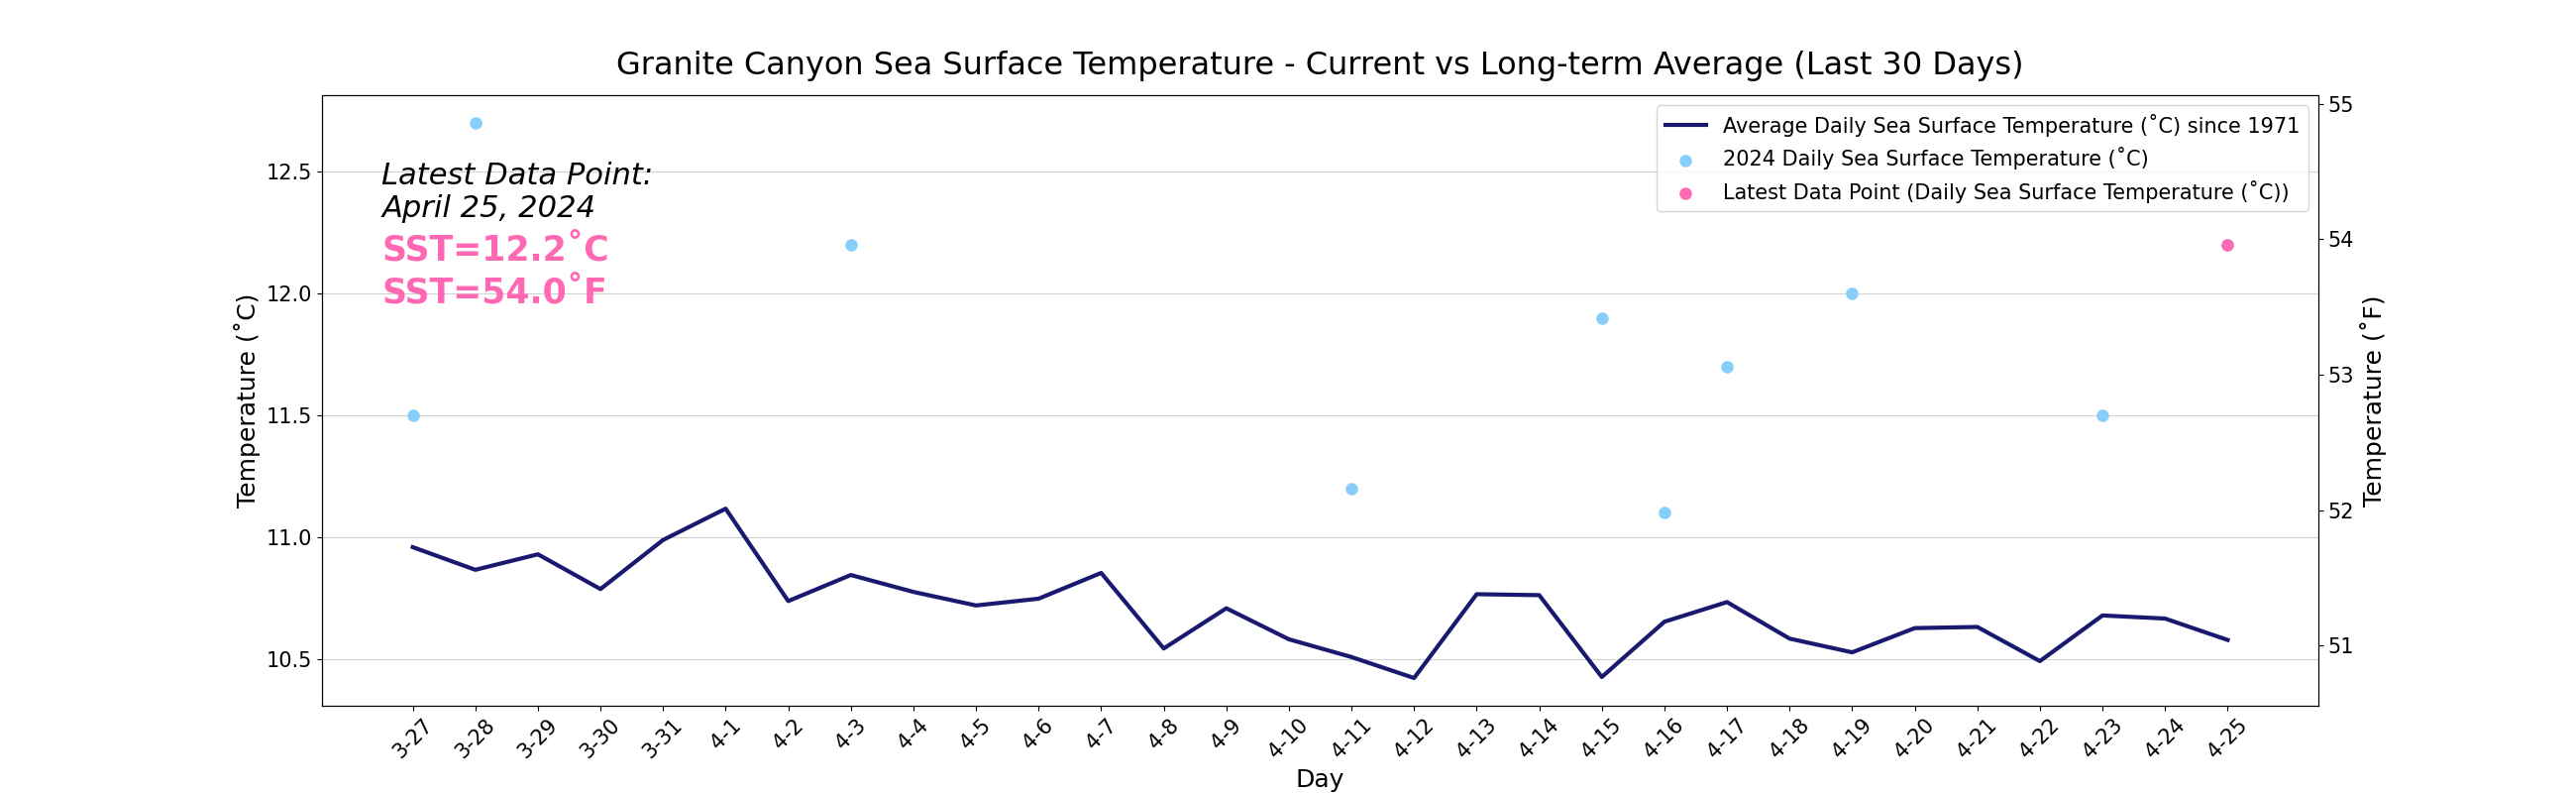
See how the daily temperature reading compares to the long term average:

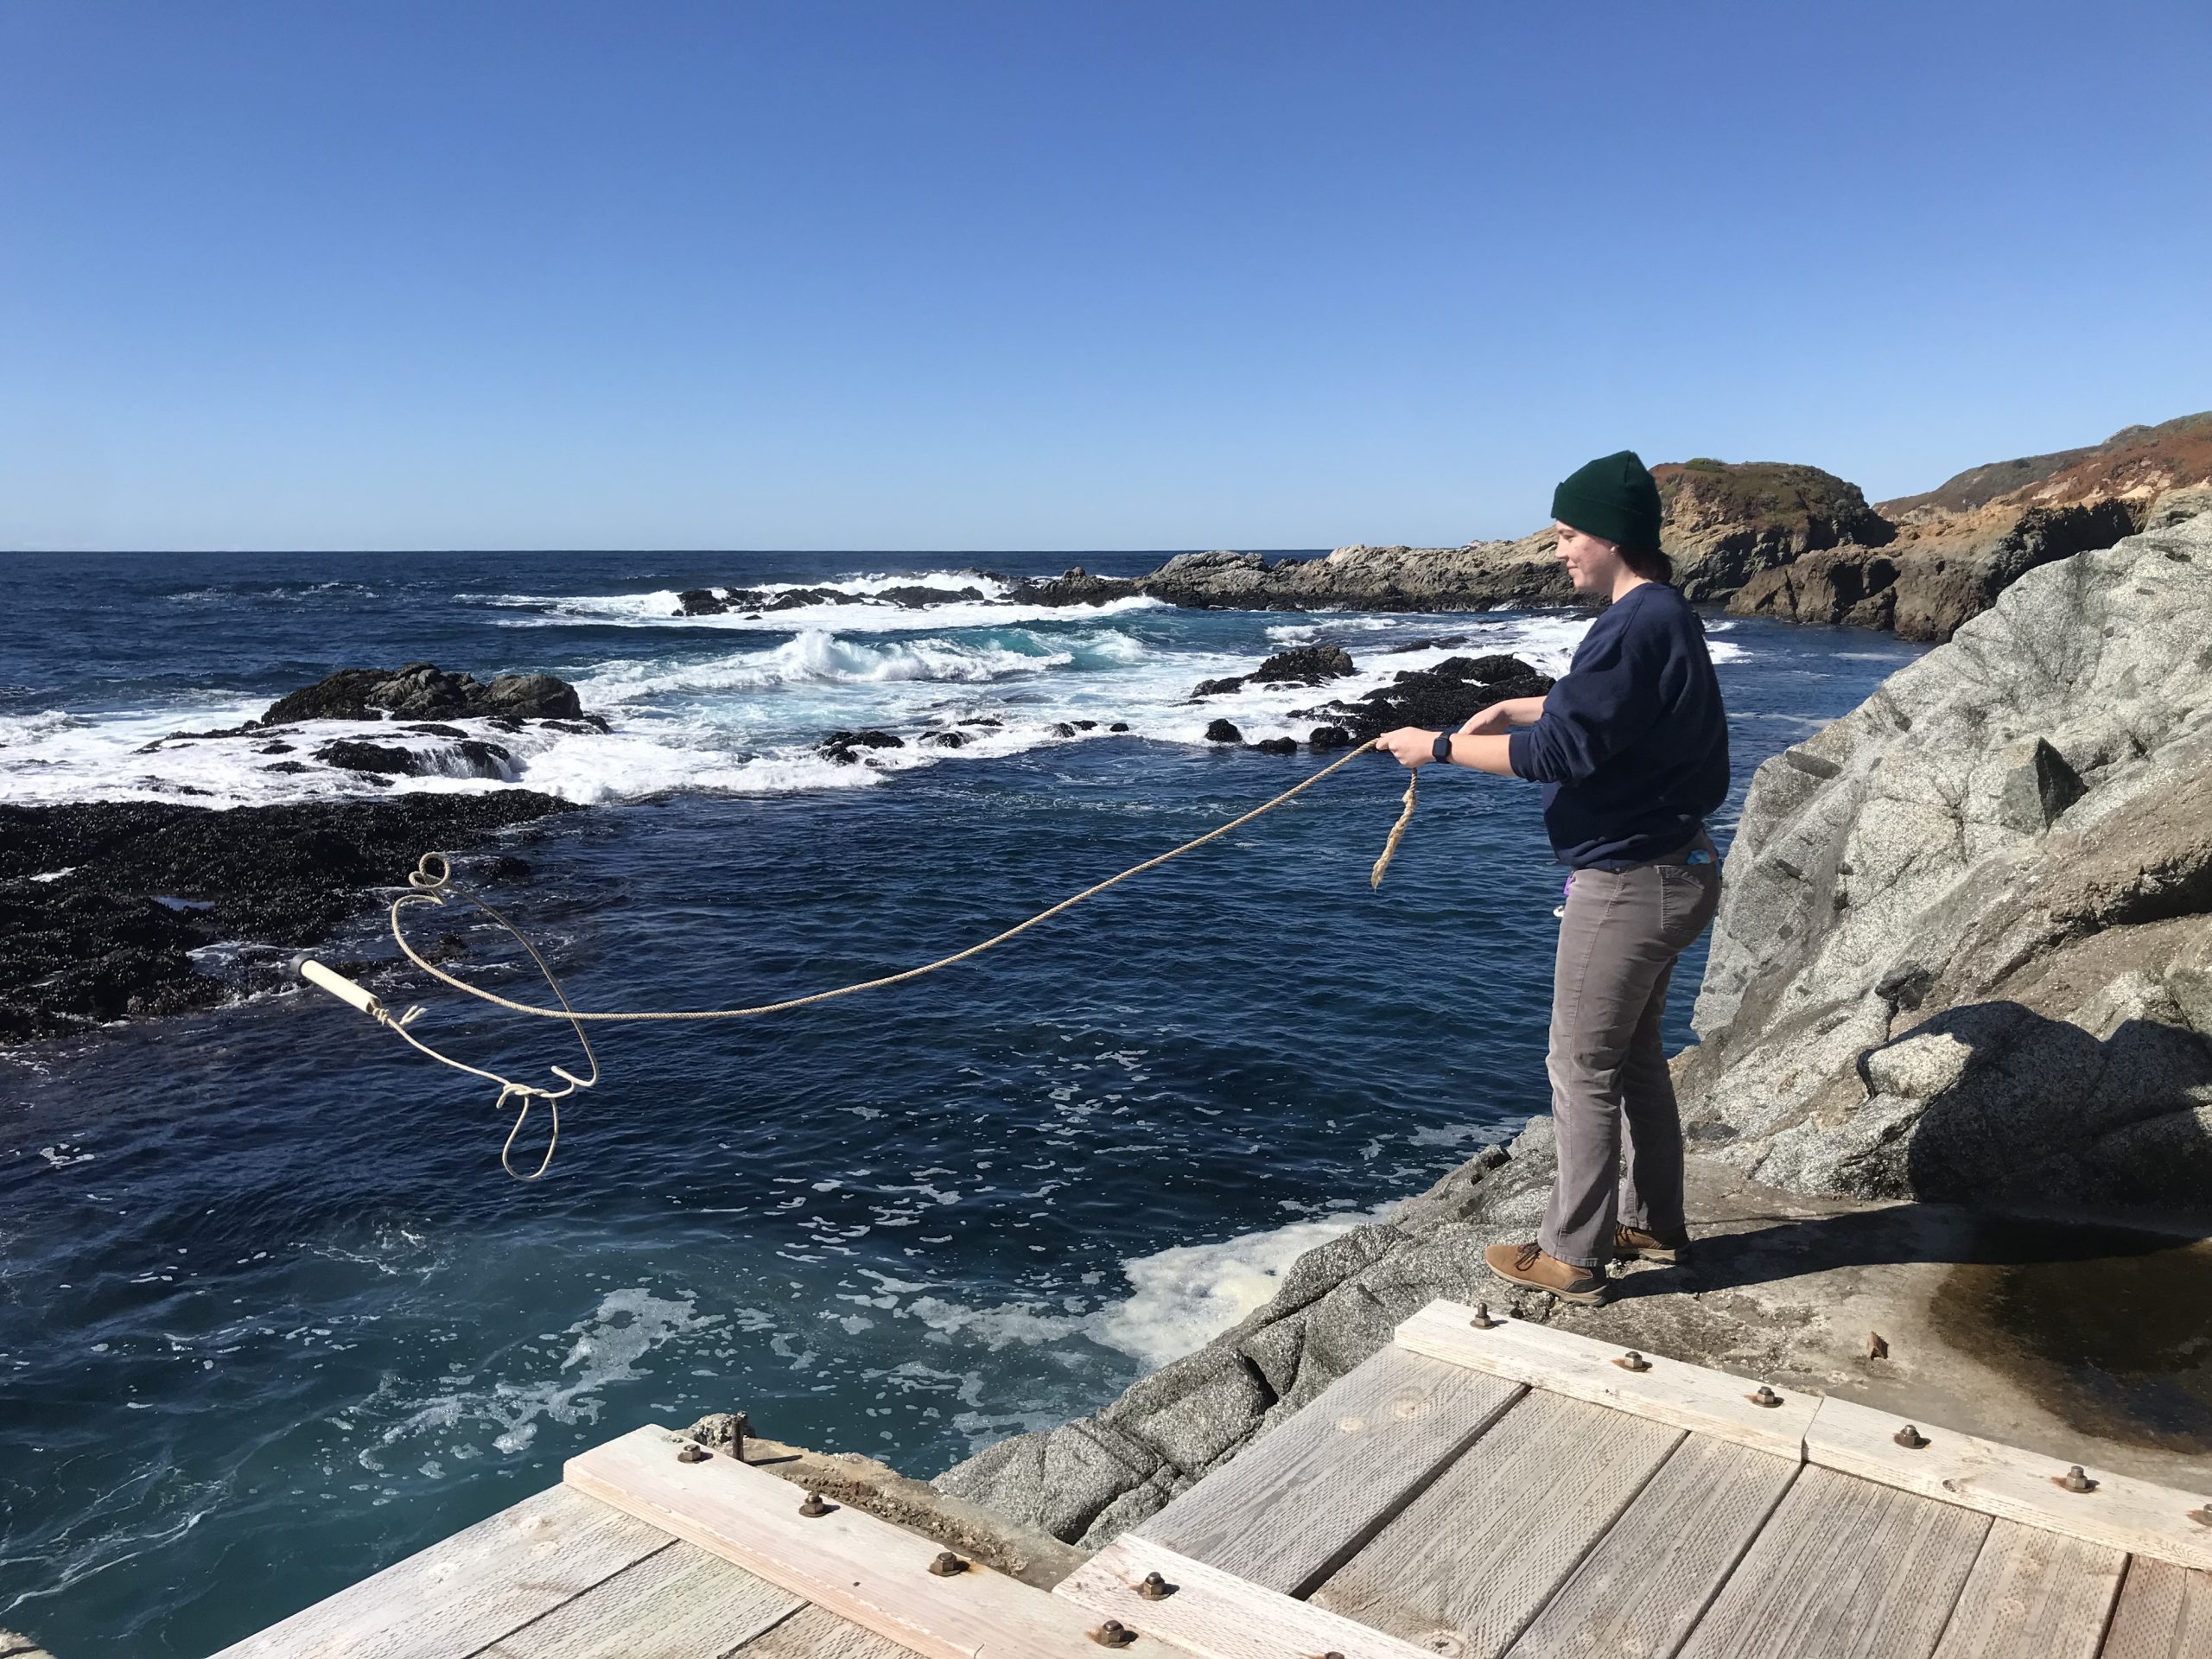
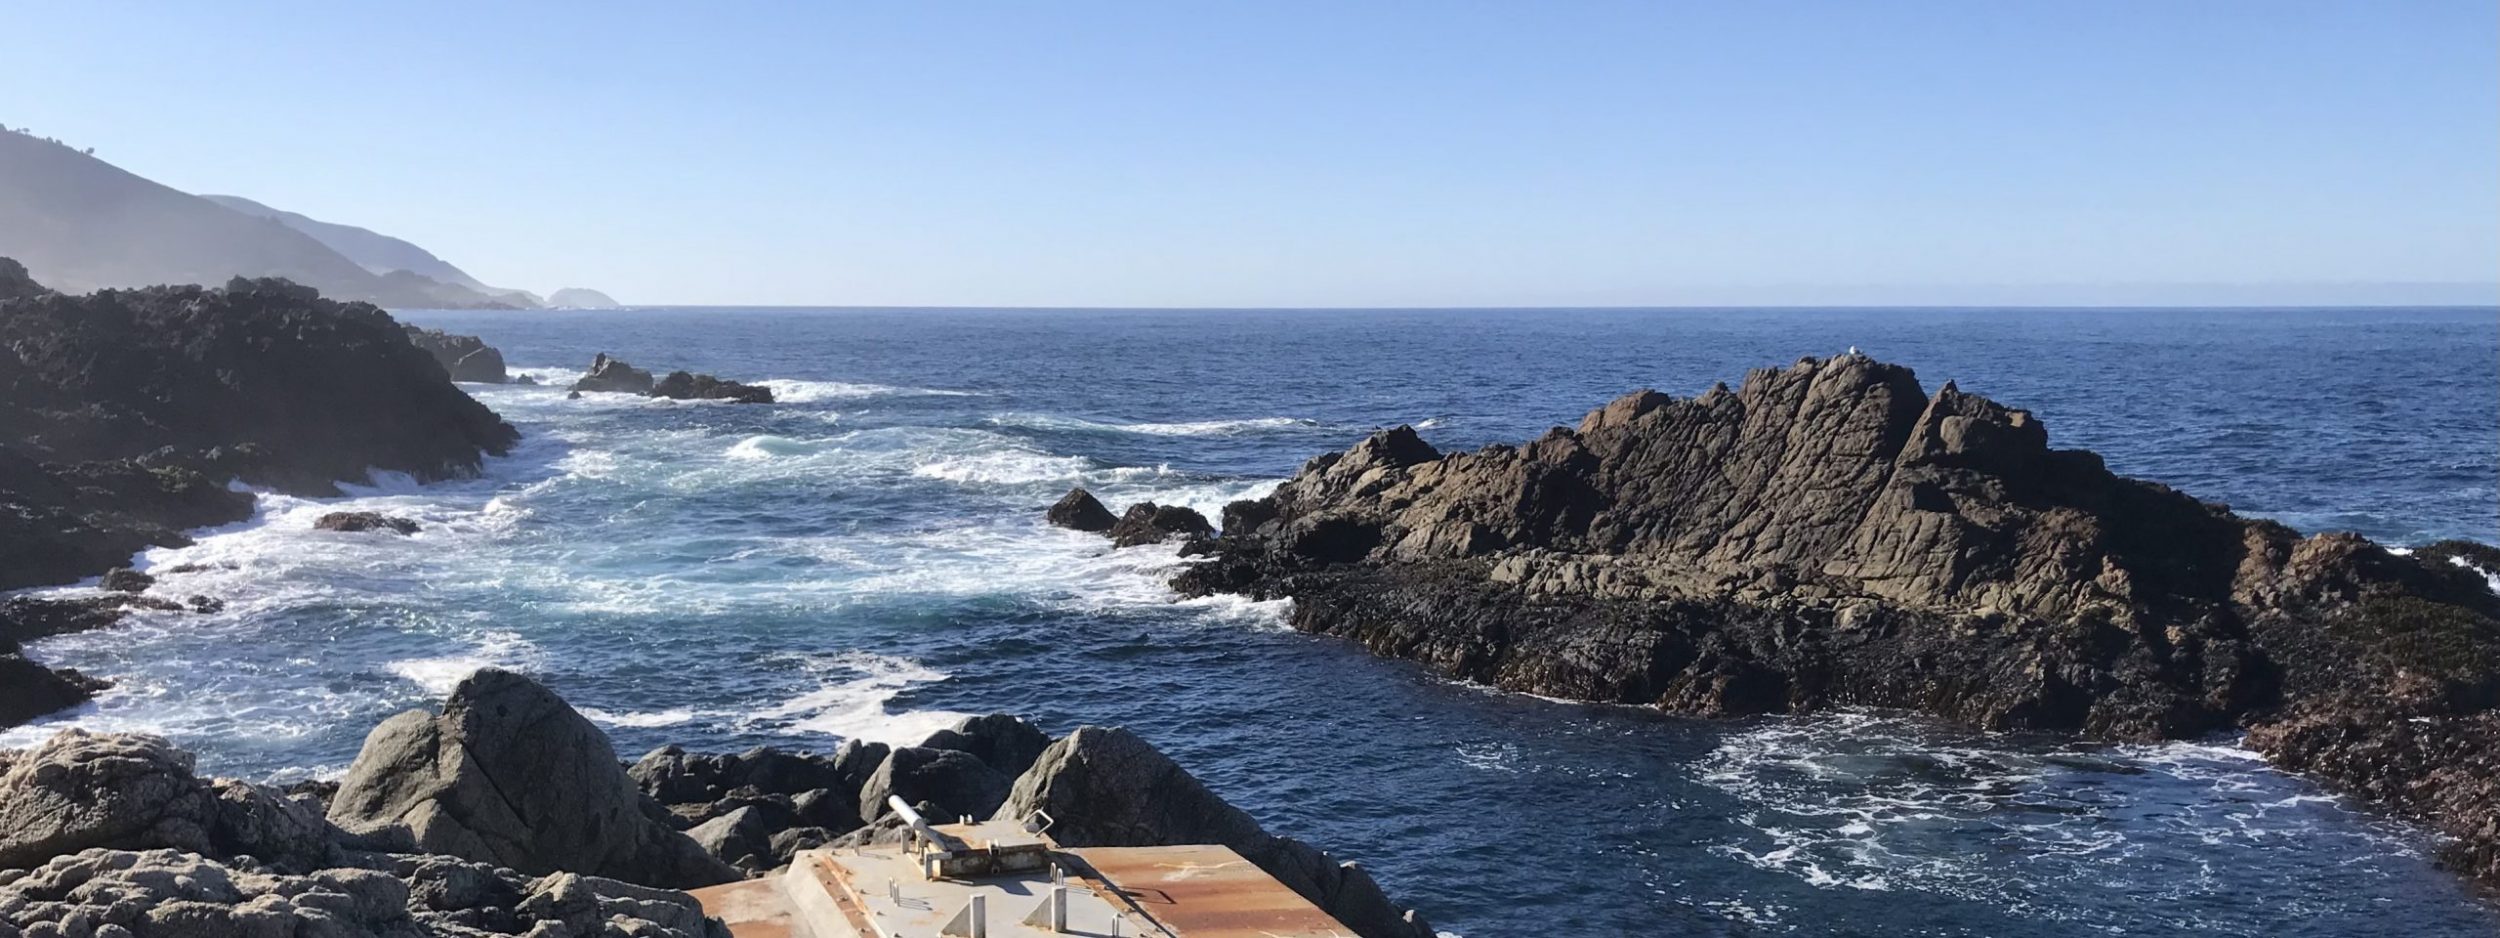
Graduate student Randi Barton retrieving a water sample at Granite Canyon for temperature and salinity measurements.
Personnel of the Marine Pollution Studies Lab at Granite Canyon take daily temperature and salinity samples off the rocks near the water intake for the laboratory, and return the salinity samples to Scripps once a month for analysis. This sampling site is considered to be a good representative of the spring-summer upwelling that is typical of the central California coast.
click here for granite canyon data from 1971-current
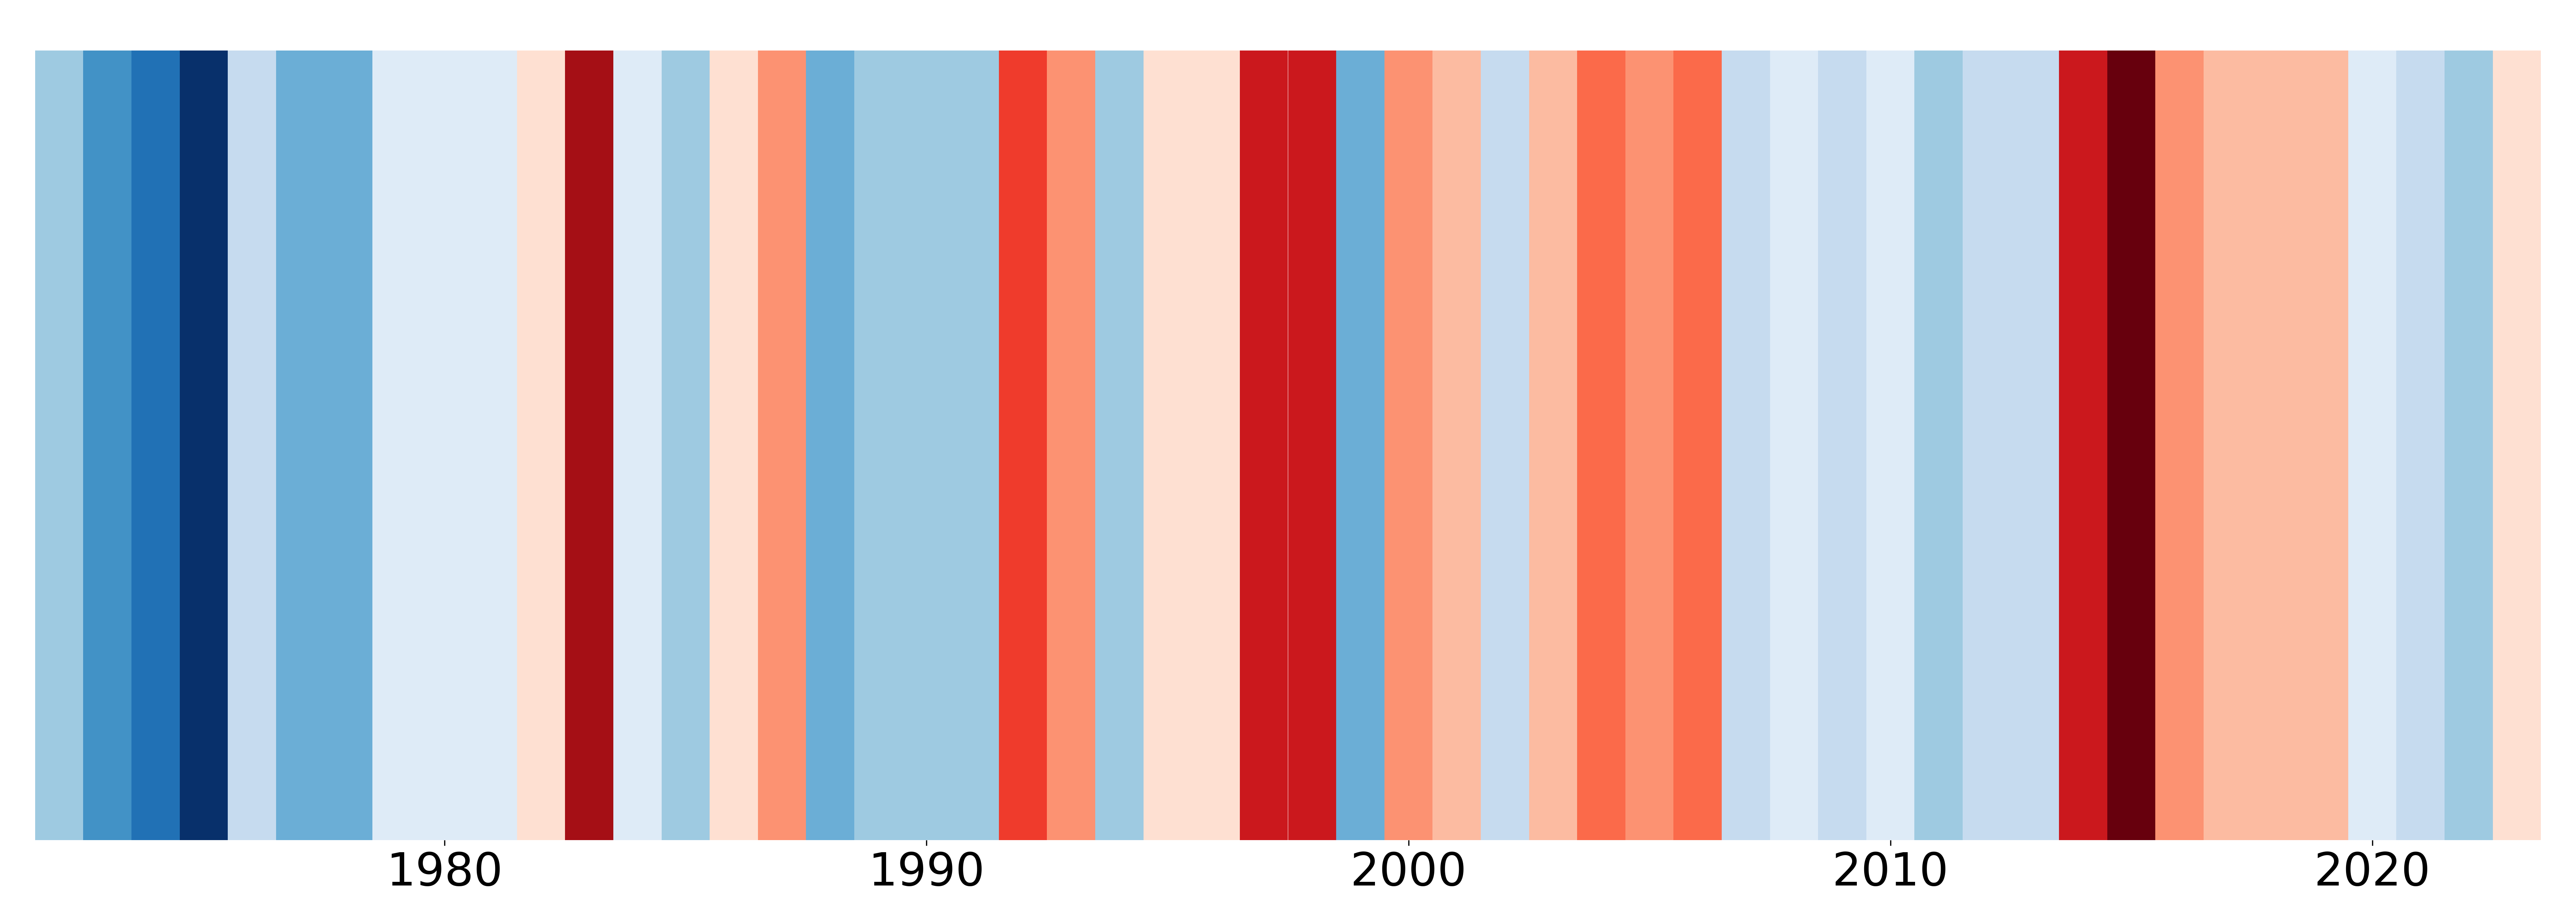
Below are figures that we have modeled after the #ShowYourStripes Campaign (created by Ed Hawkins), to help us visualize how sea surface temperature has changed at Granite Canyon since 1971. The change in temperature is relative to the average temperature calculated between 1971-2023.
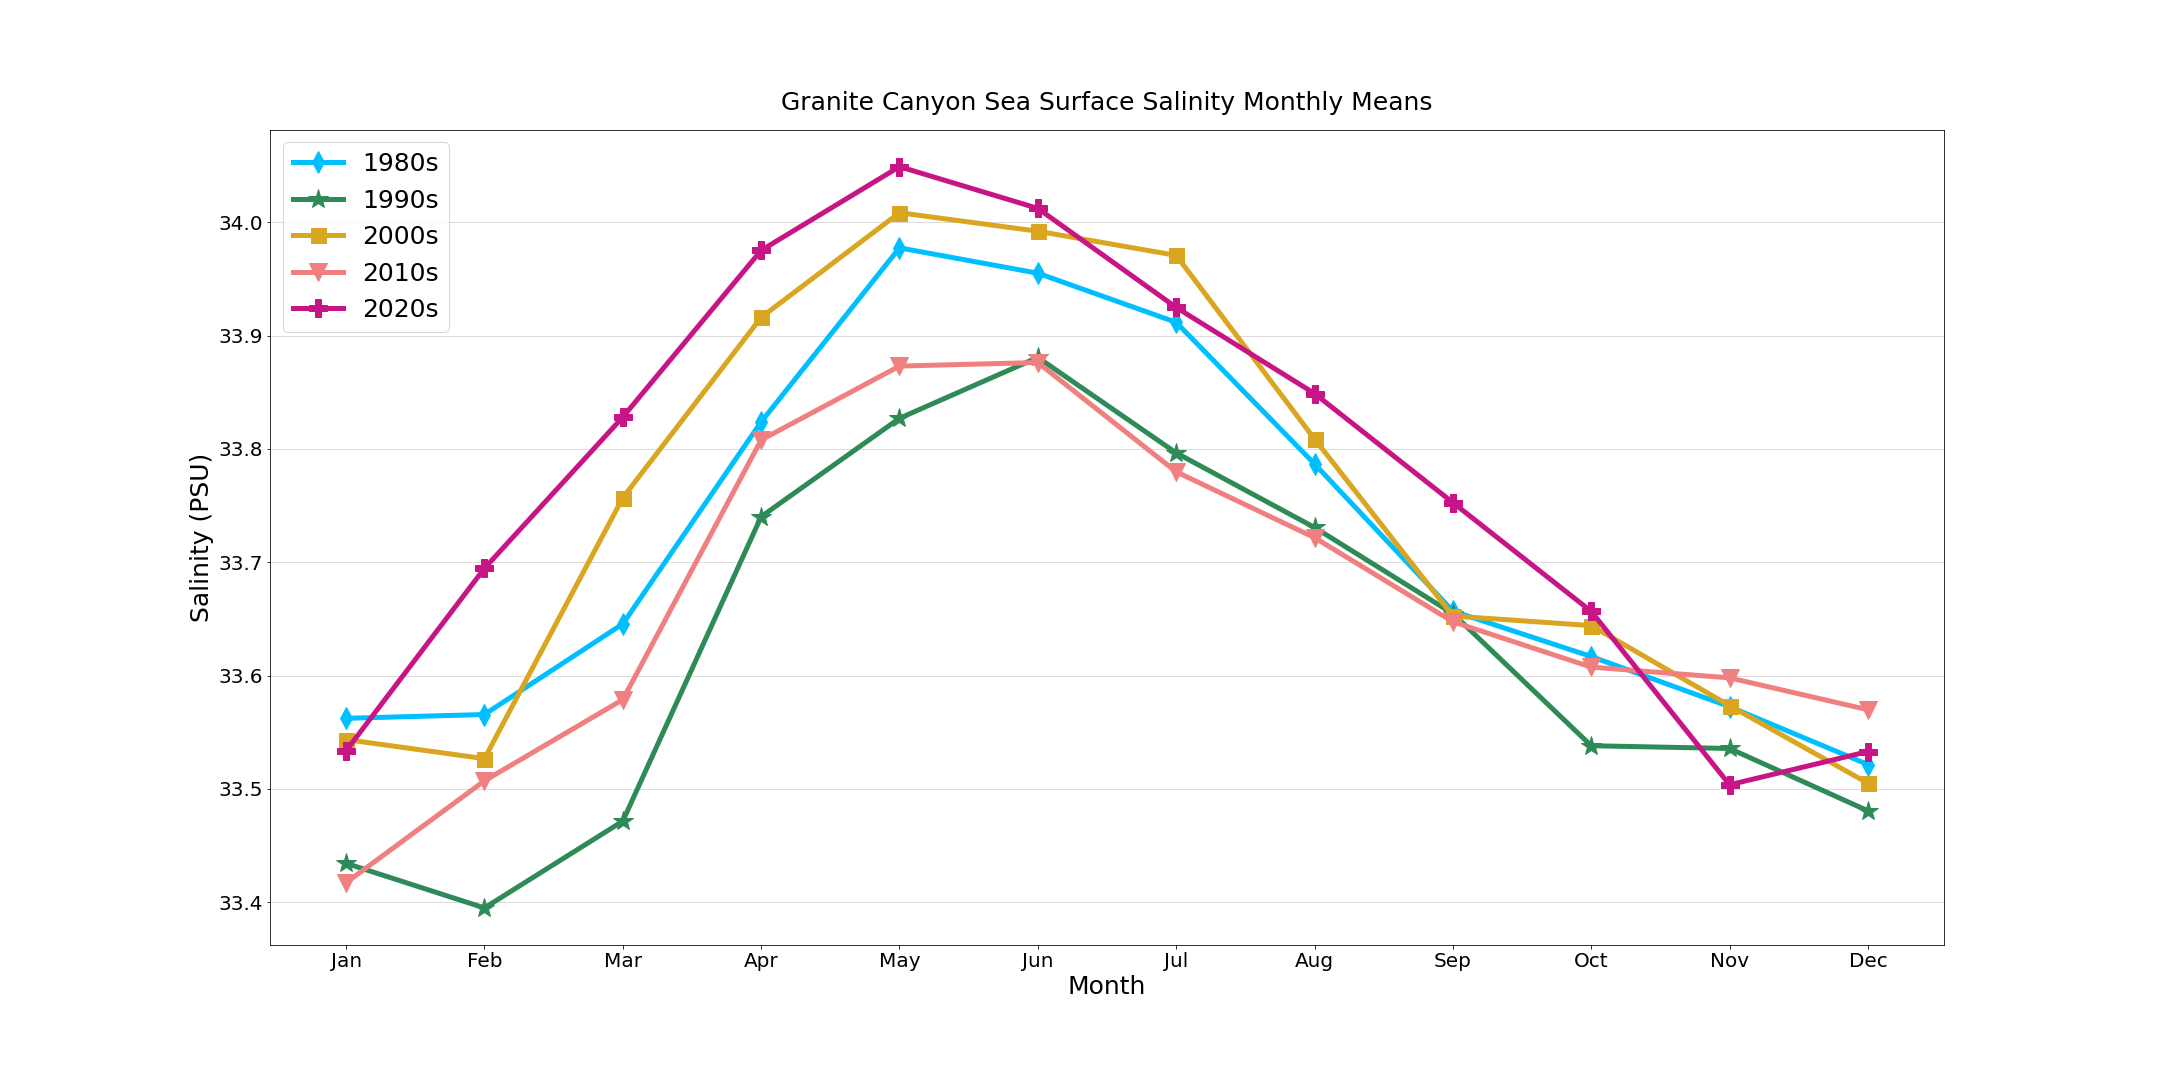
Below you can see a plot showing Monthly Sea Surface Temperature and Salinity Averages from the Granite Canyon Shore Station, split up by decade, since 1971.

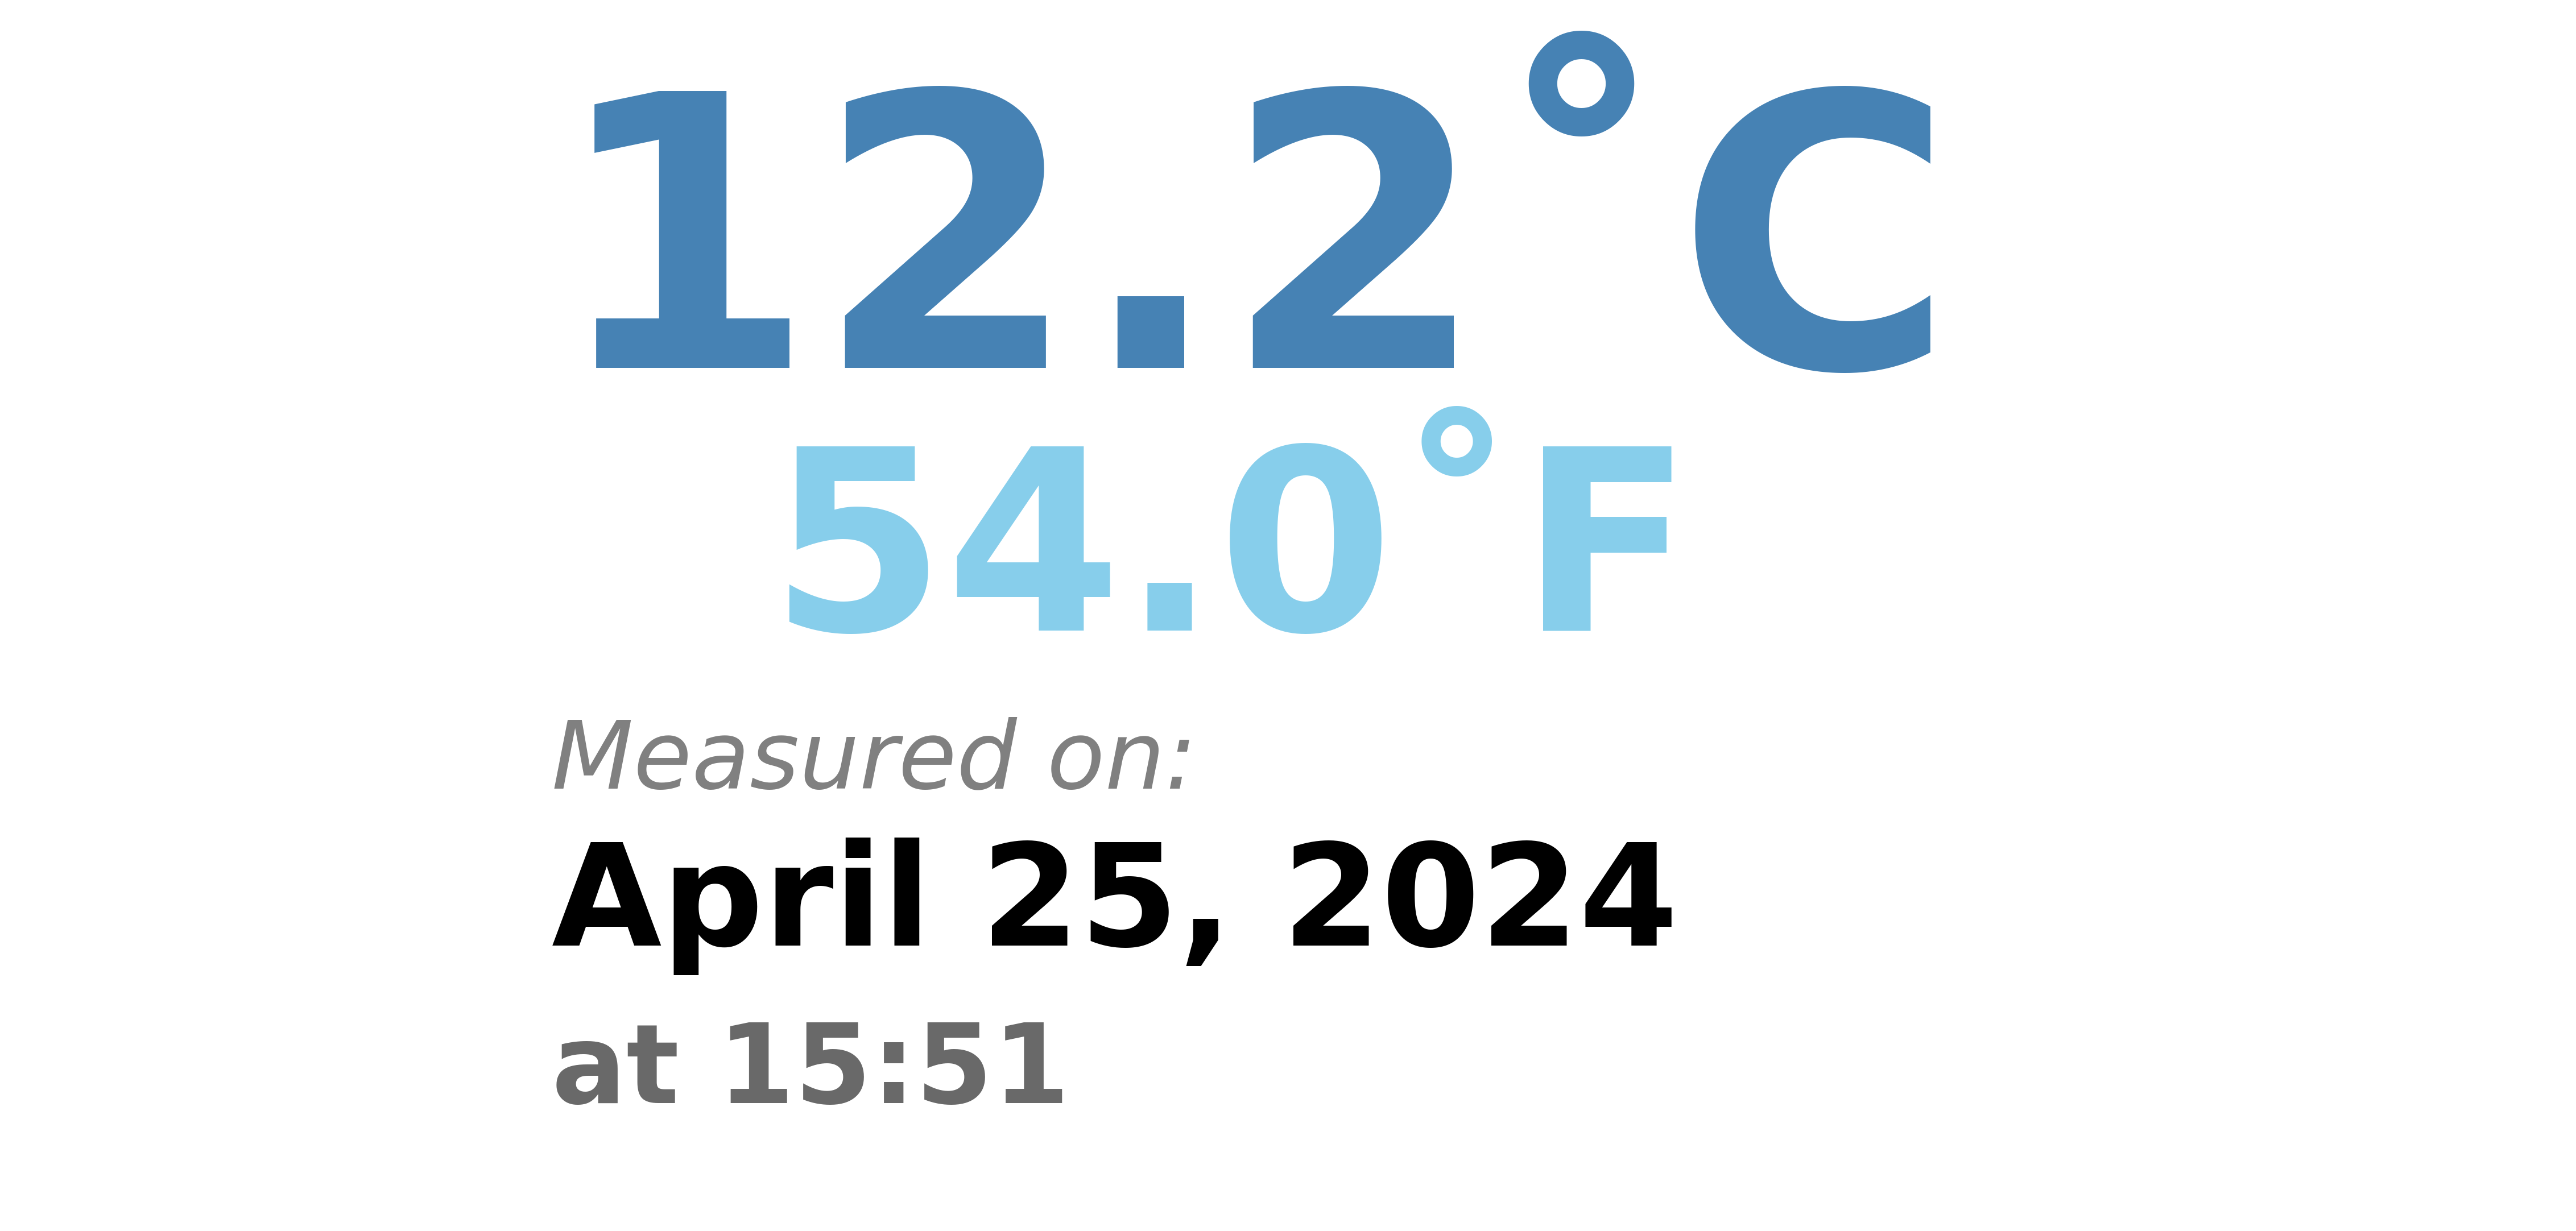
recent data