
Note: sometimes the daily temperature is not taken


Note: sometimes the daily temperature is not taken

Total number of Shore Station samples collected at Trinidad Bay:

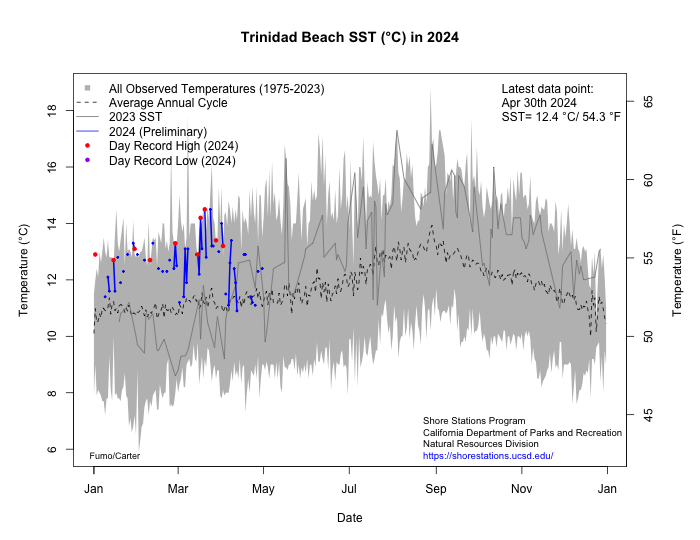
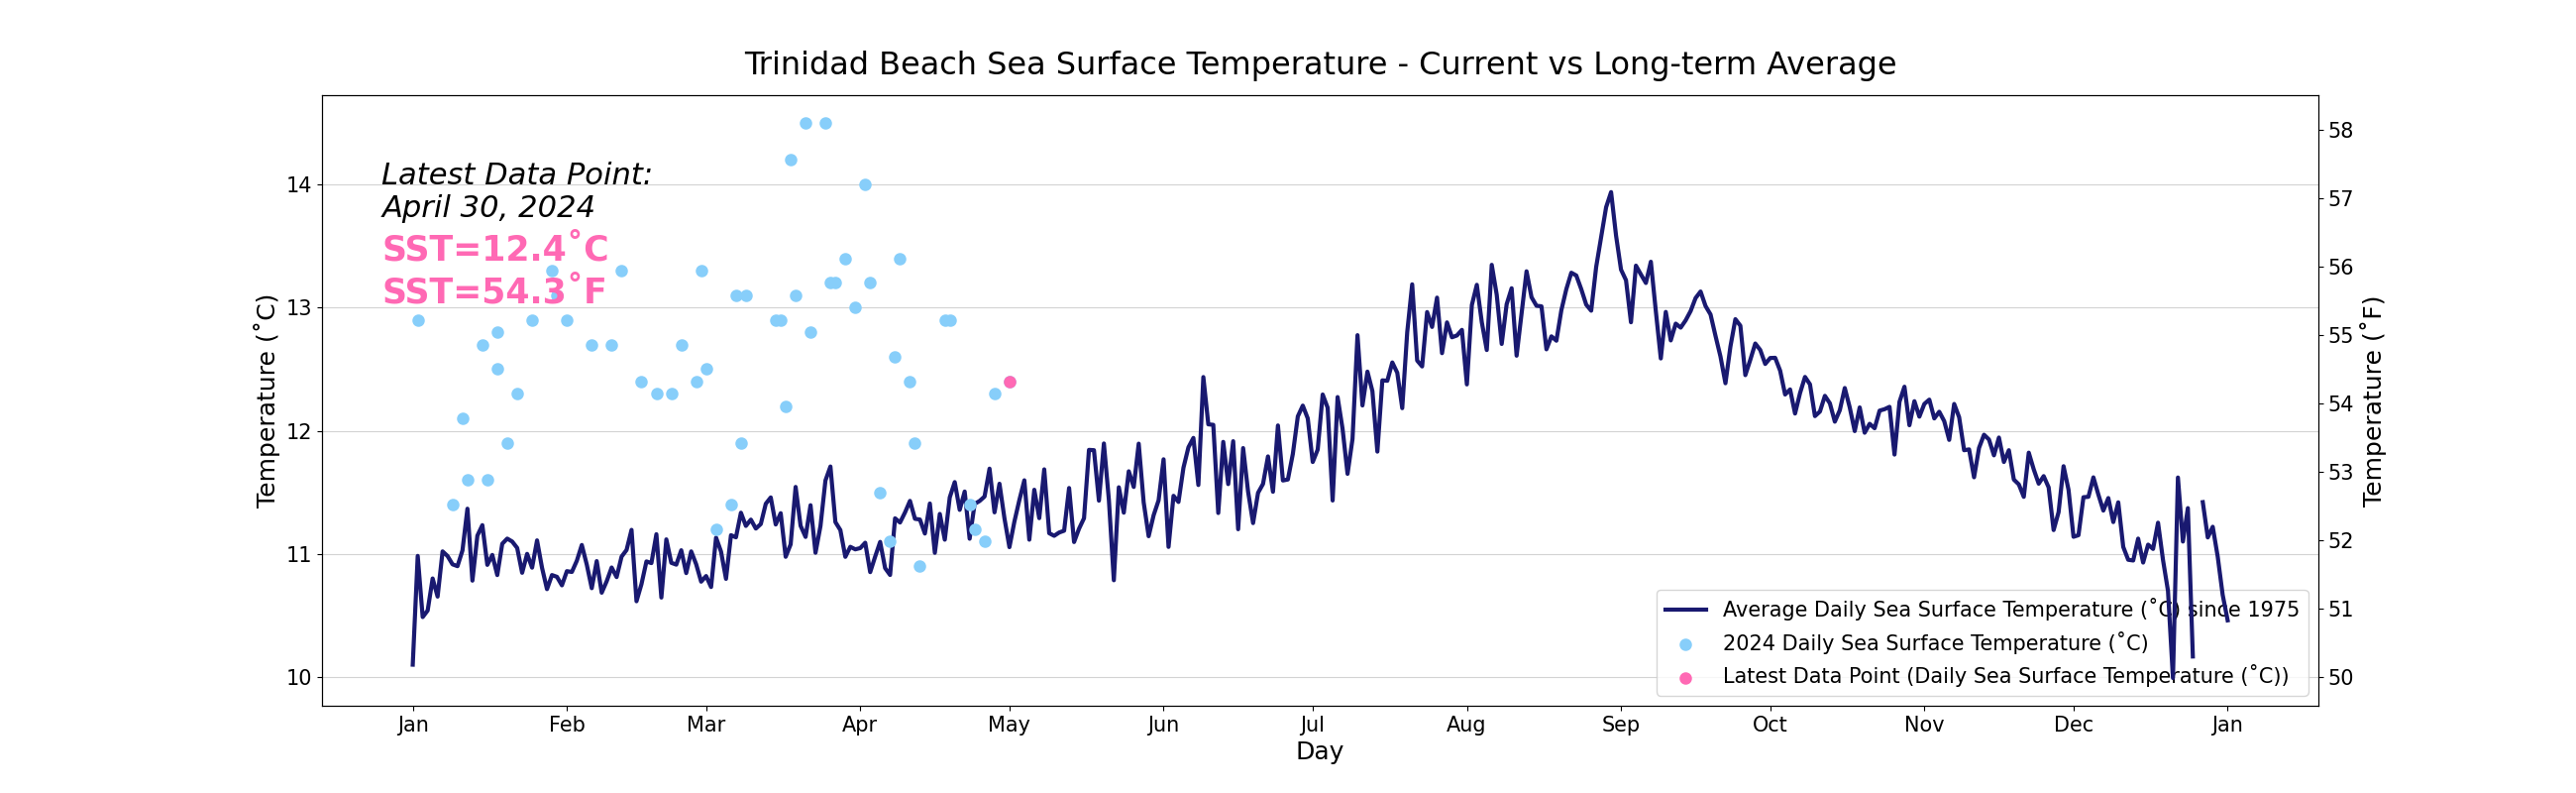
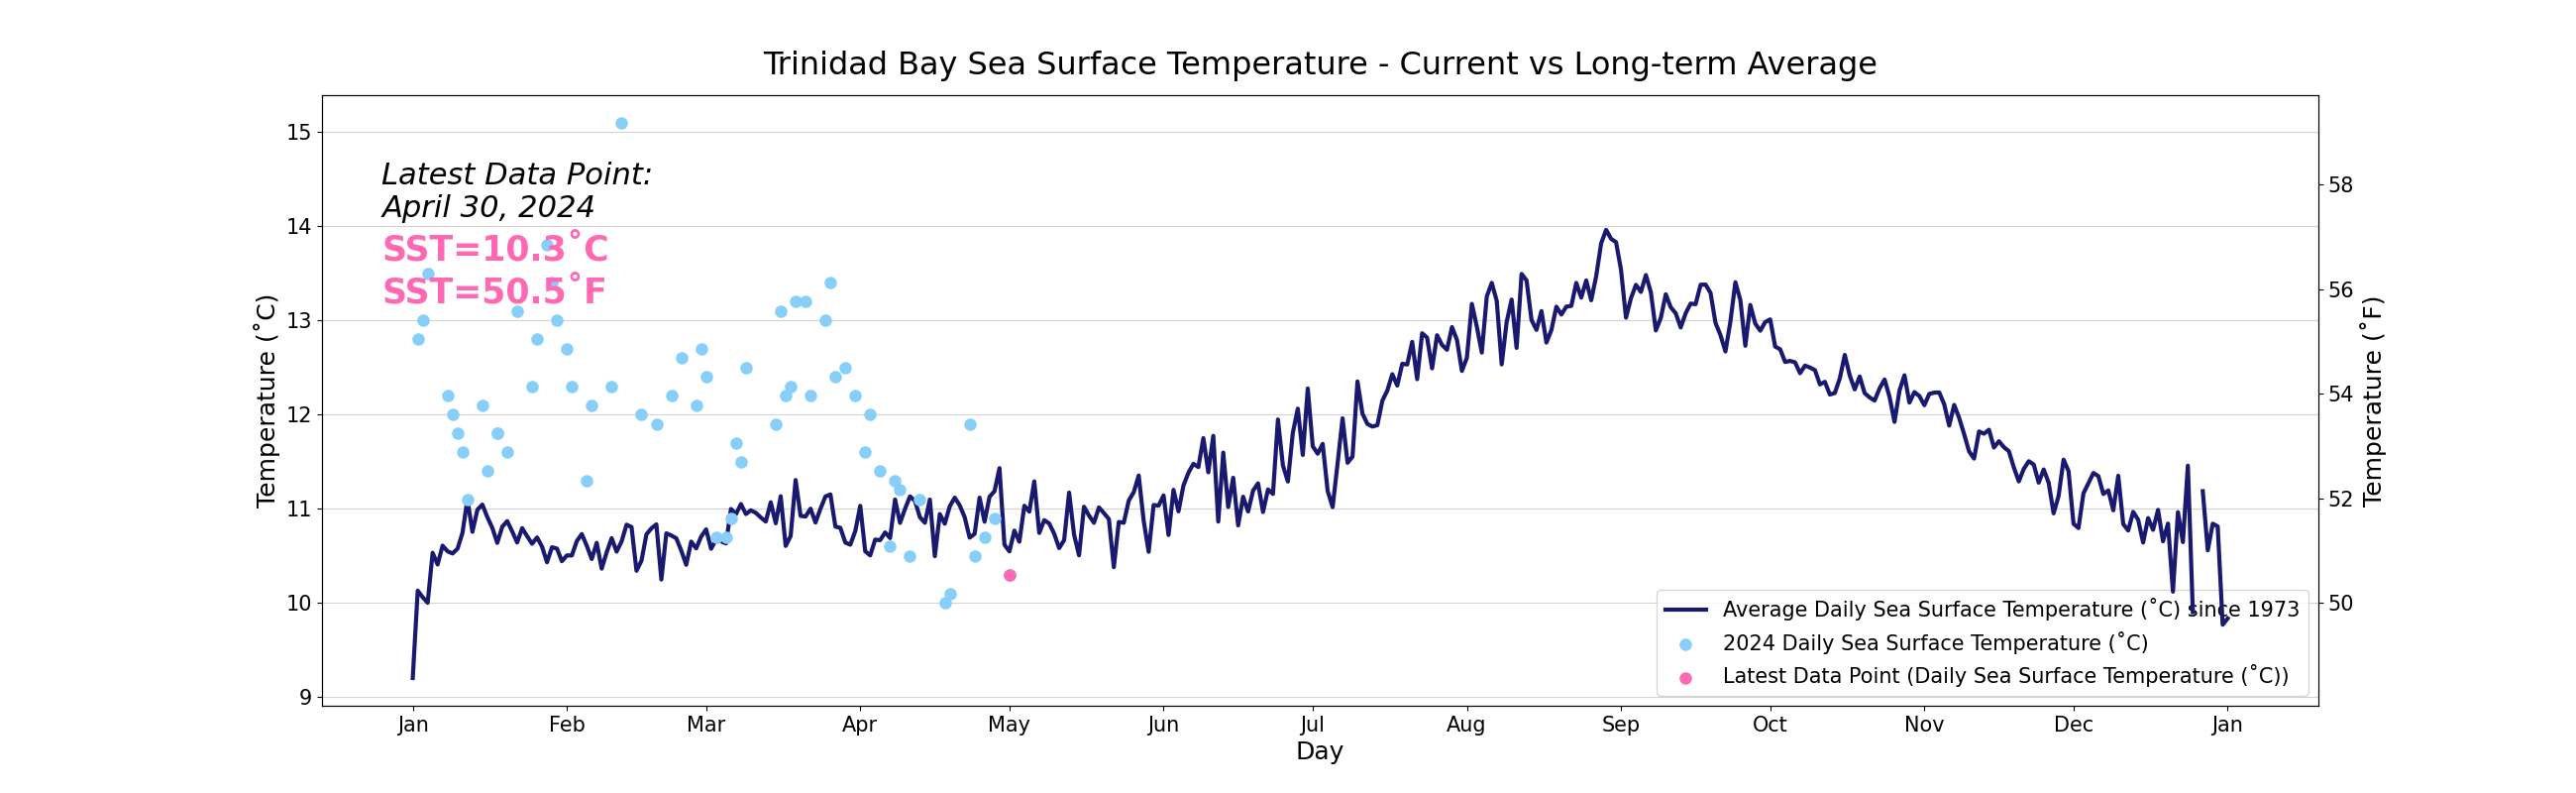
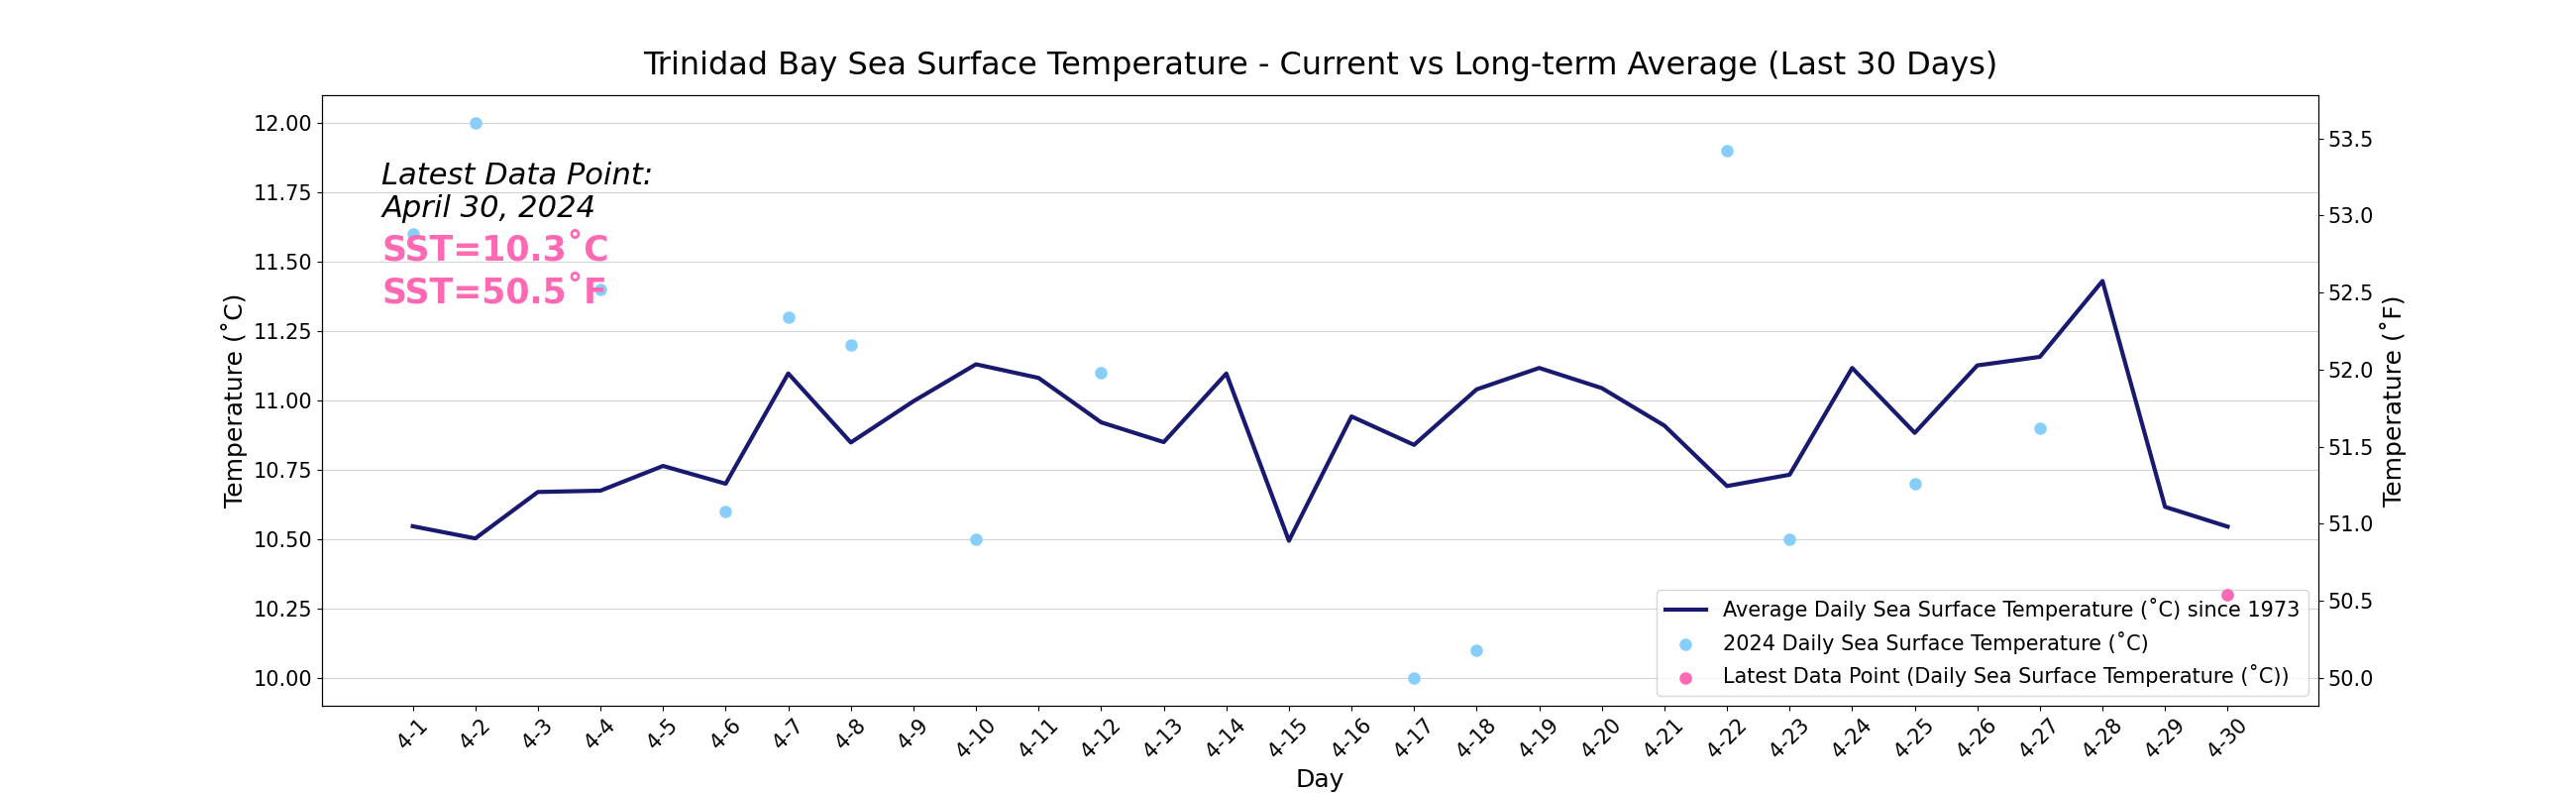
See how the daily temperature reading compares to the long term average:
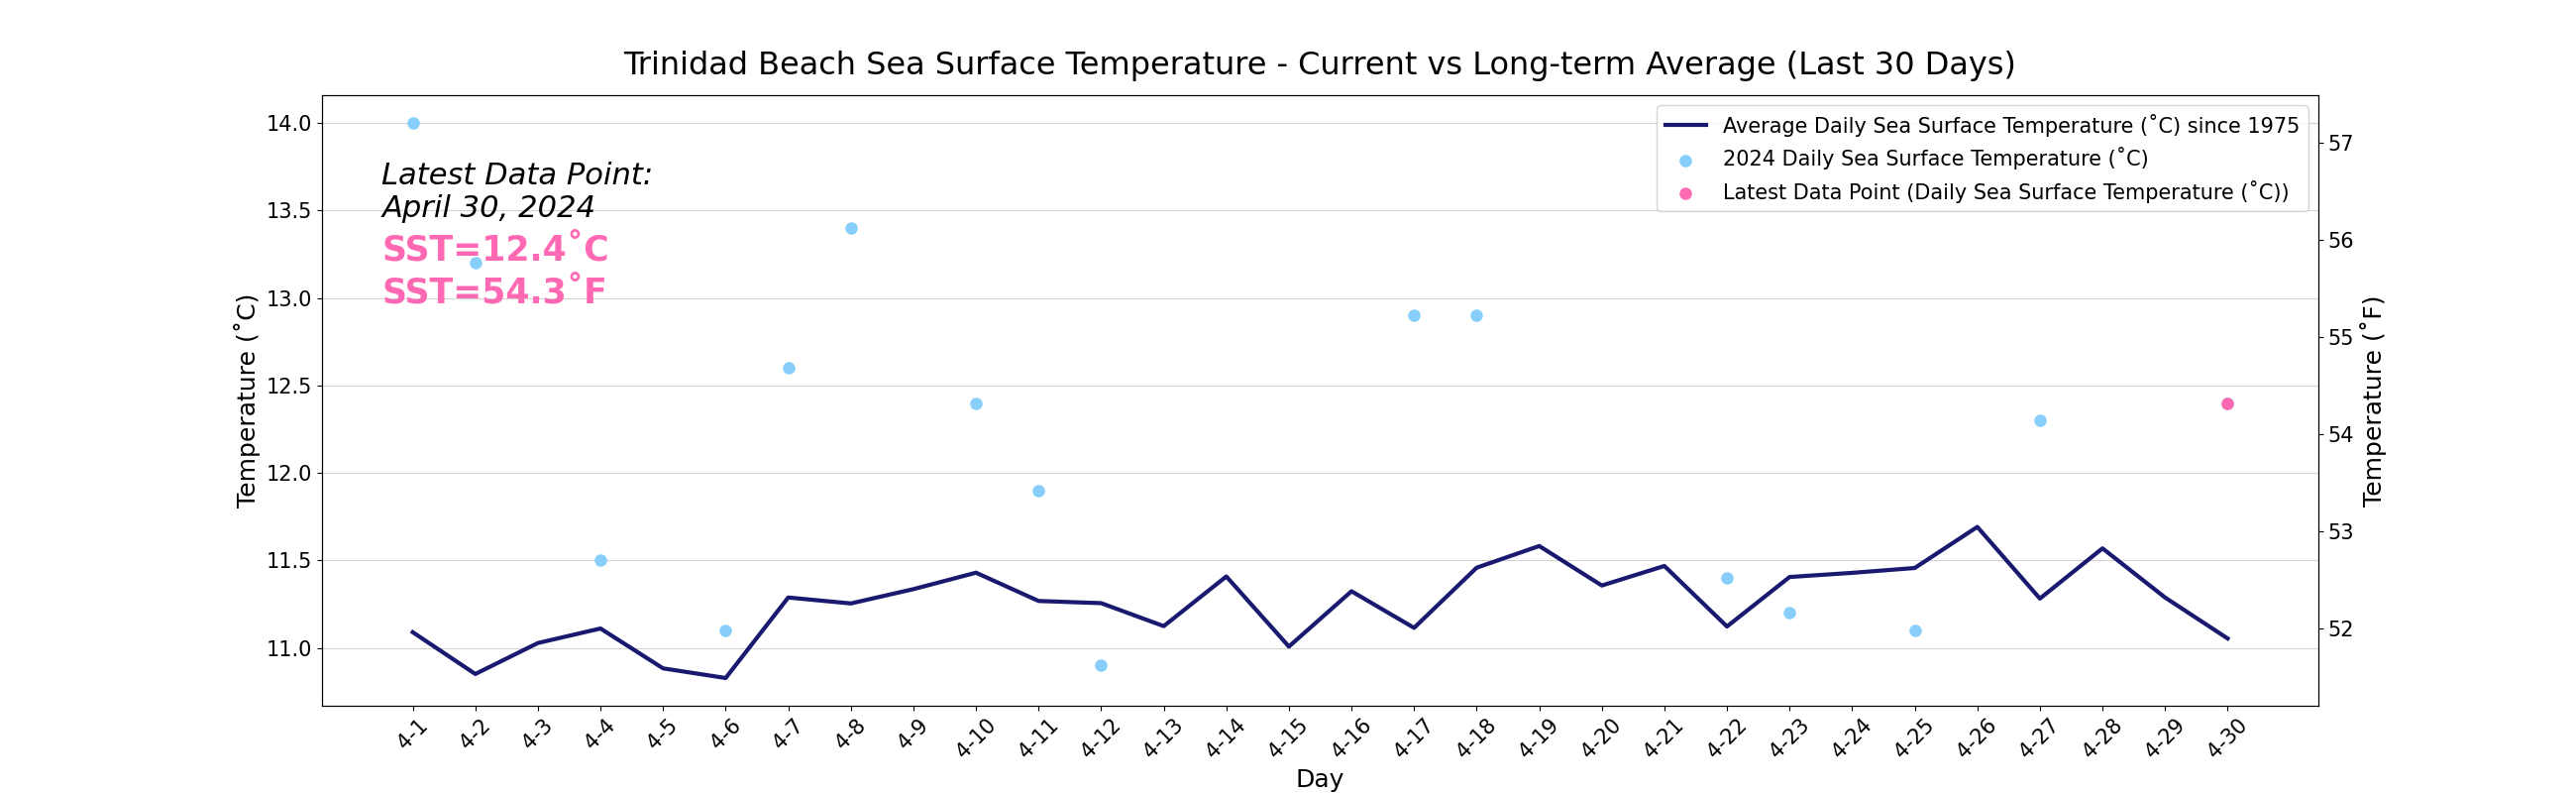
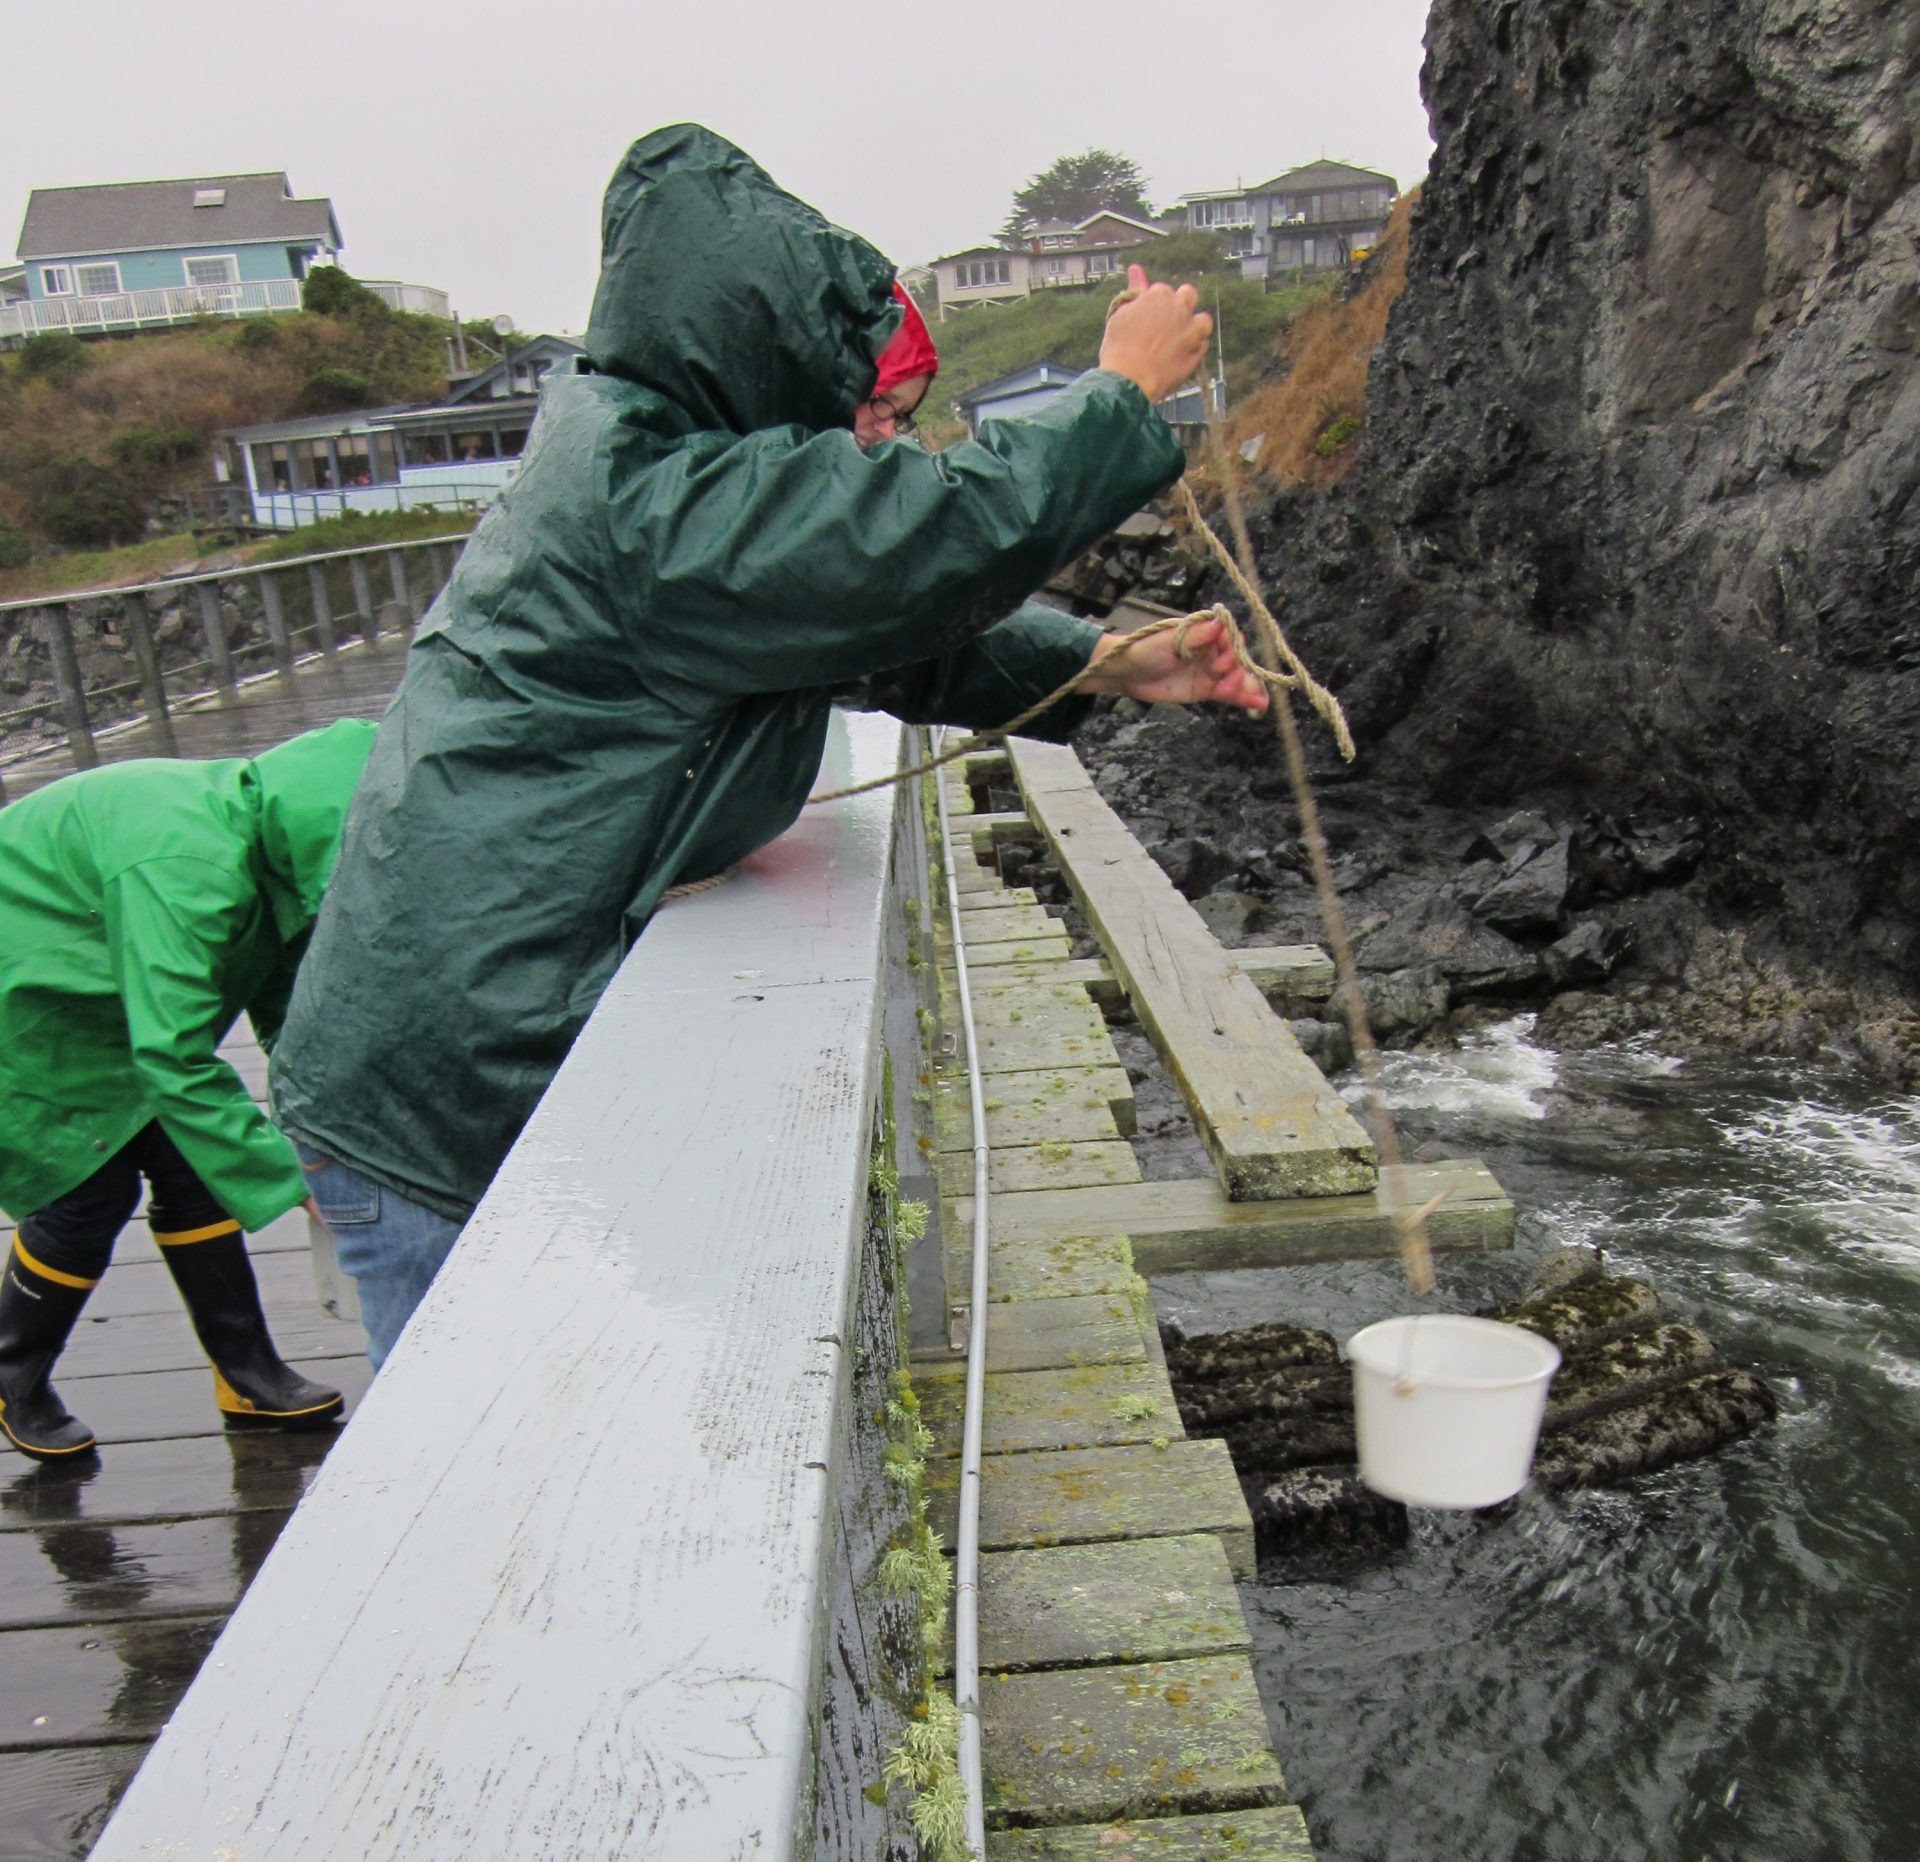
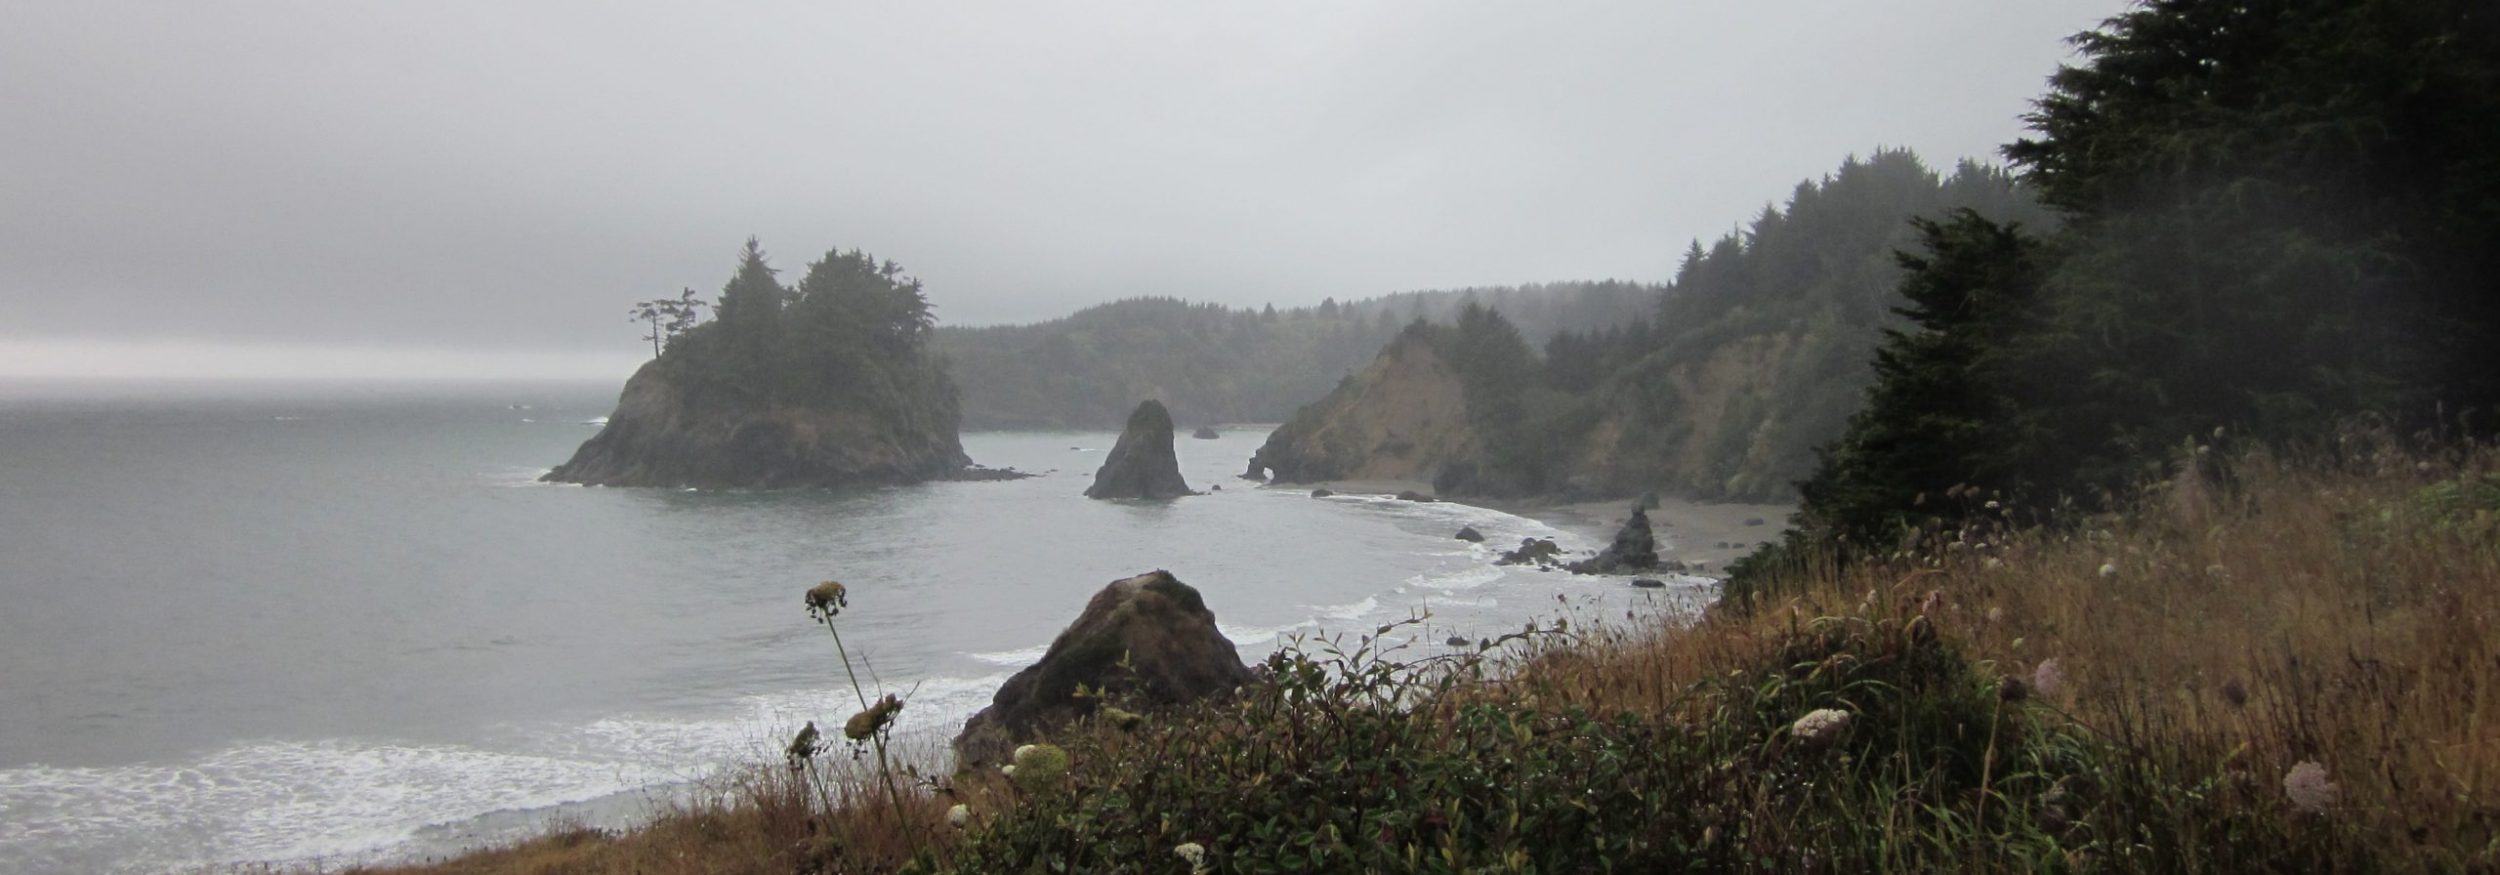
Student lab technicians and staff from Cal Poly Humboldt Telonicher Marine Laboratory collect daily temperature and salinity samples from the northwest side of Trinidad State Beach which is located on the rocky headland between the Pacific Ocean and Trinidad Bay. Salinity samples are returned to Scripps once a month for analysis.
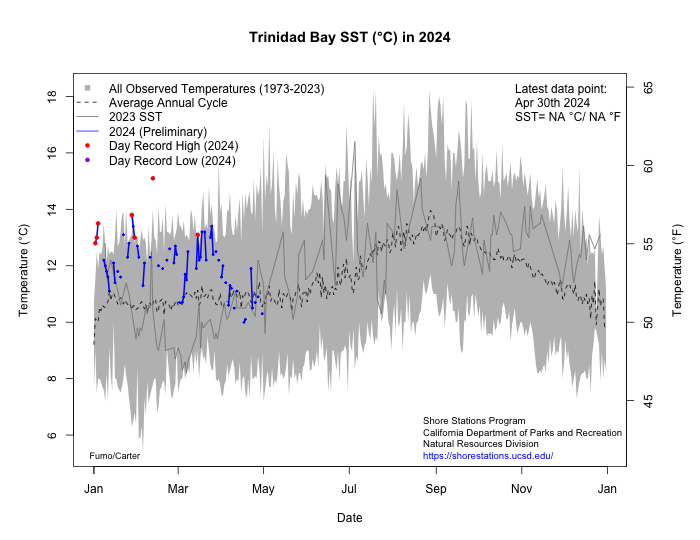
Except during periods of heavy runoff, salinity values from the coast and the bay are nearly identical. The student lab technicians also collect daily temperature measurements from the fishing pier on the lee or southeast side of the rocky headland between the Pacific Ocean and Trinidad Bay. Salinity samples are collected at this location if surf conditions are too rough for Trinidad Beach.
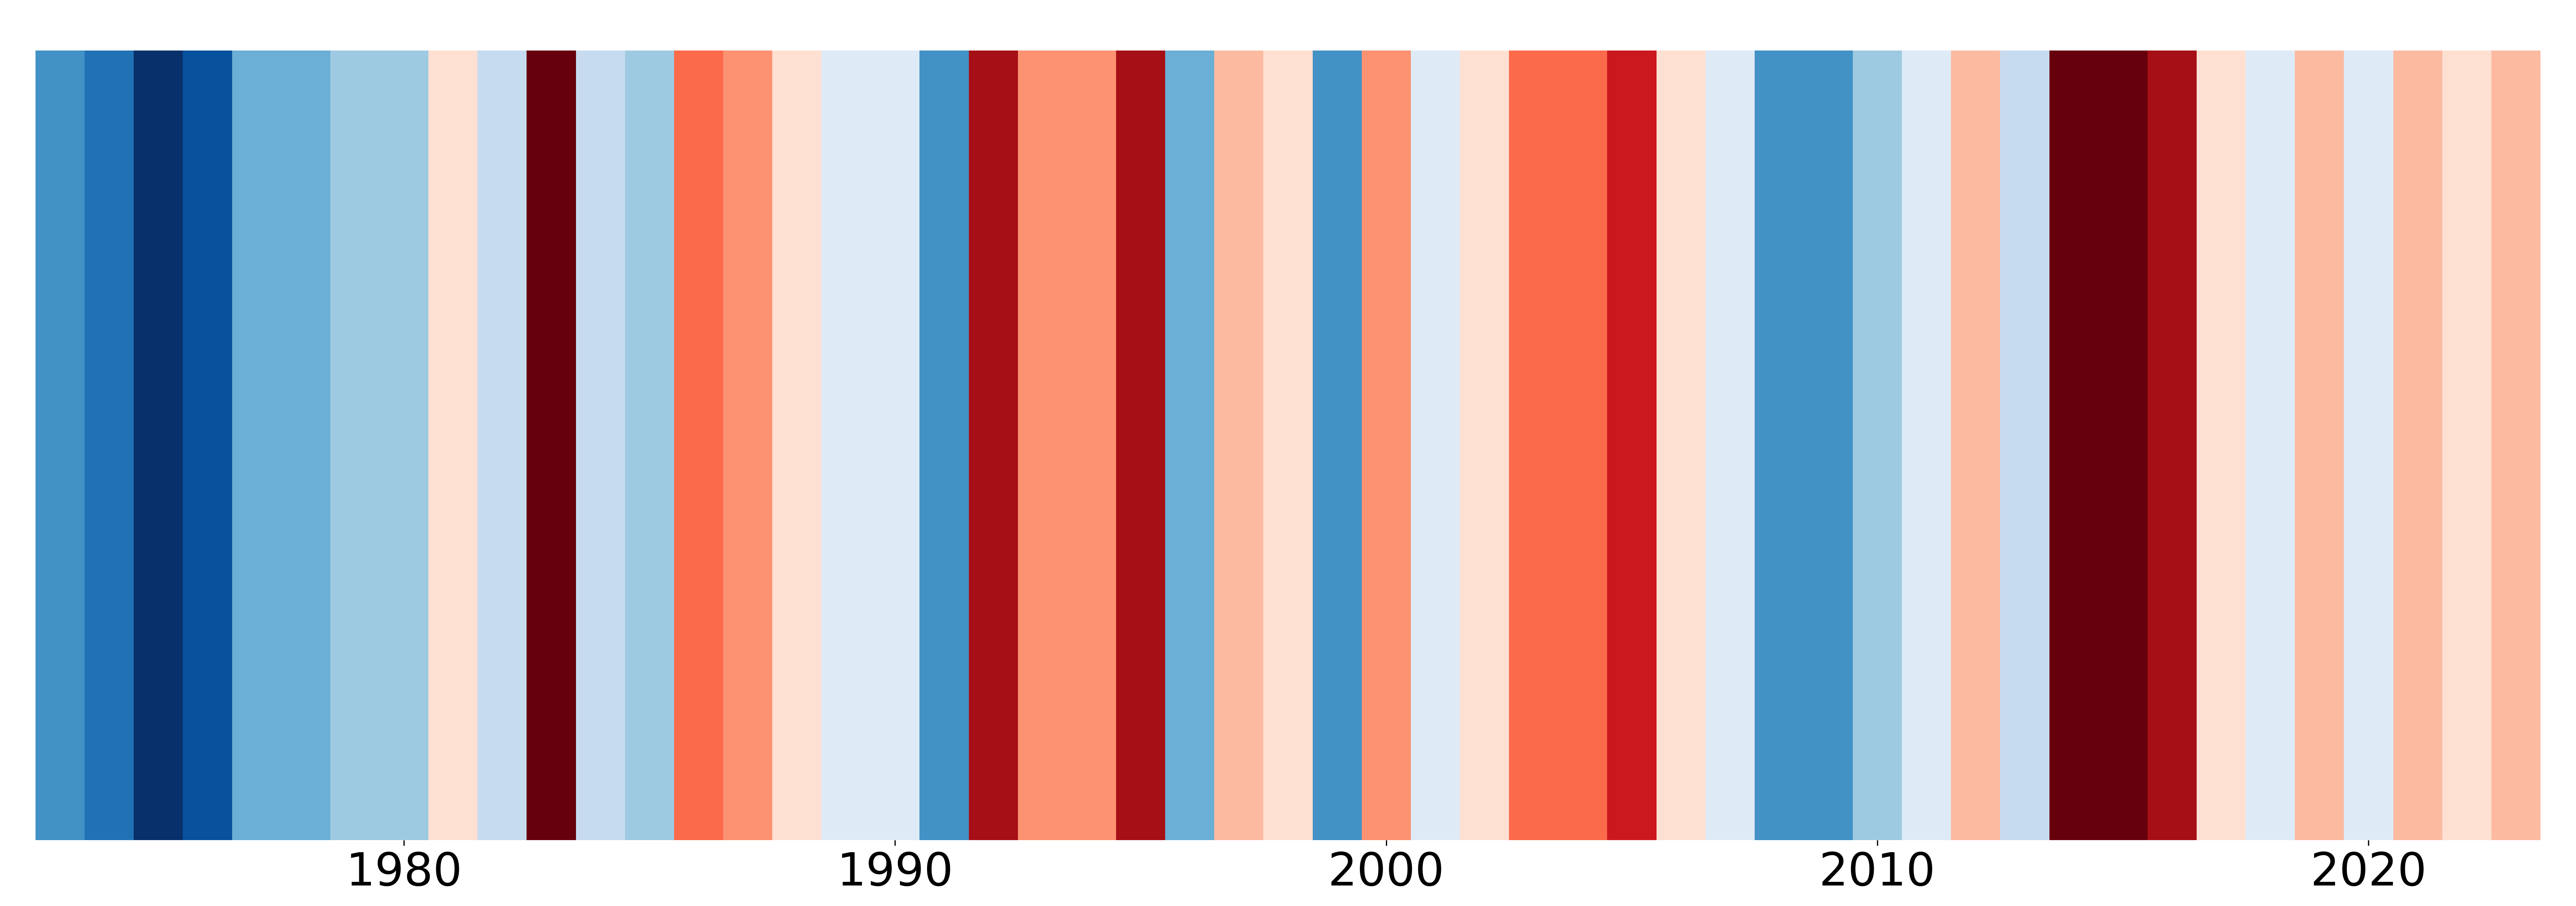
Below are figures that we have modeled after the #ShowYourStripes Campaign (created by Ed Hawkins), to help us visualize how sea surface temperature has changed at Trinidad Beach since 1975 and Trinidad Bay since 1973. The change in temperature is relative to the average temperature calculated between 1975-2023 (Beach) and 1973-2023 (Bay).
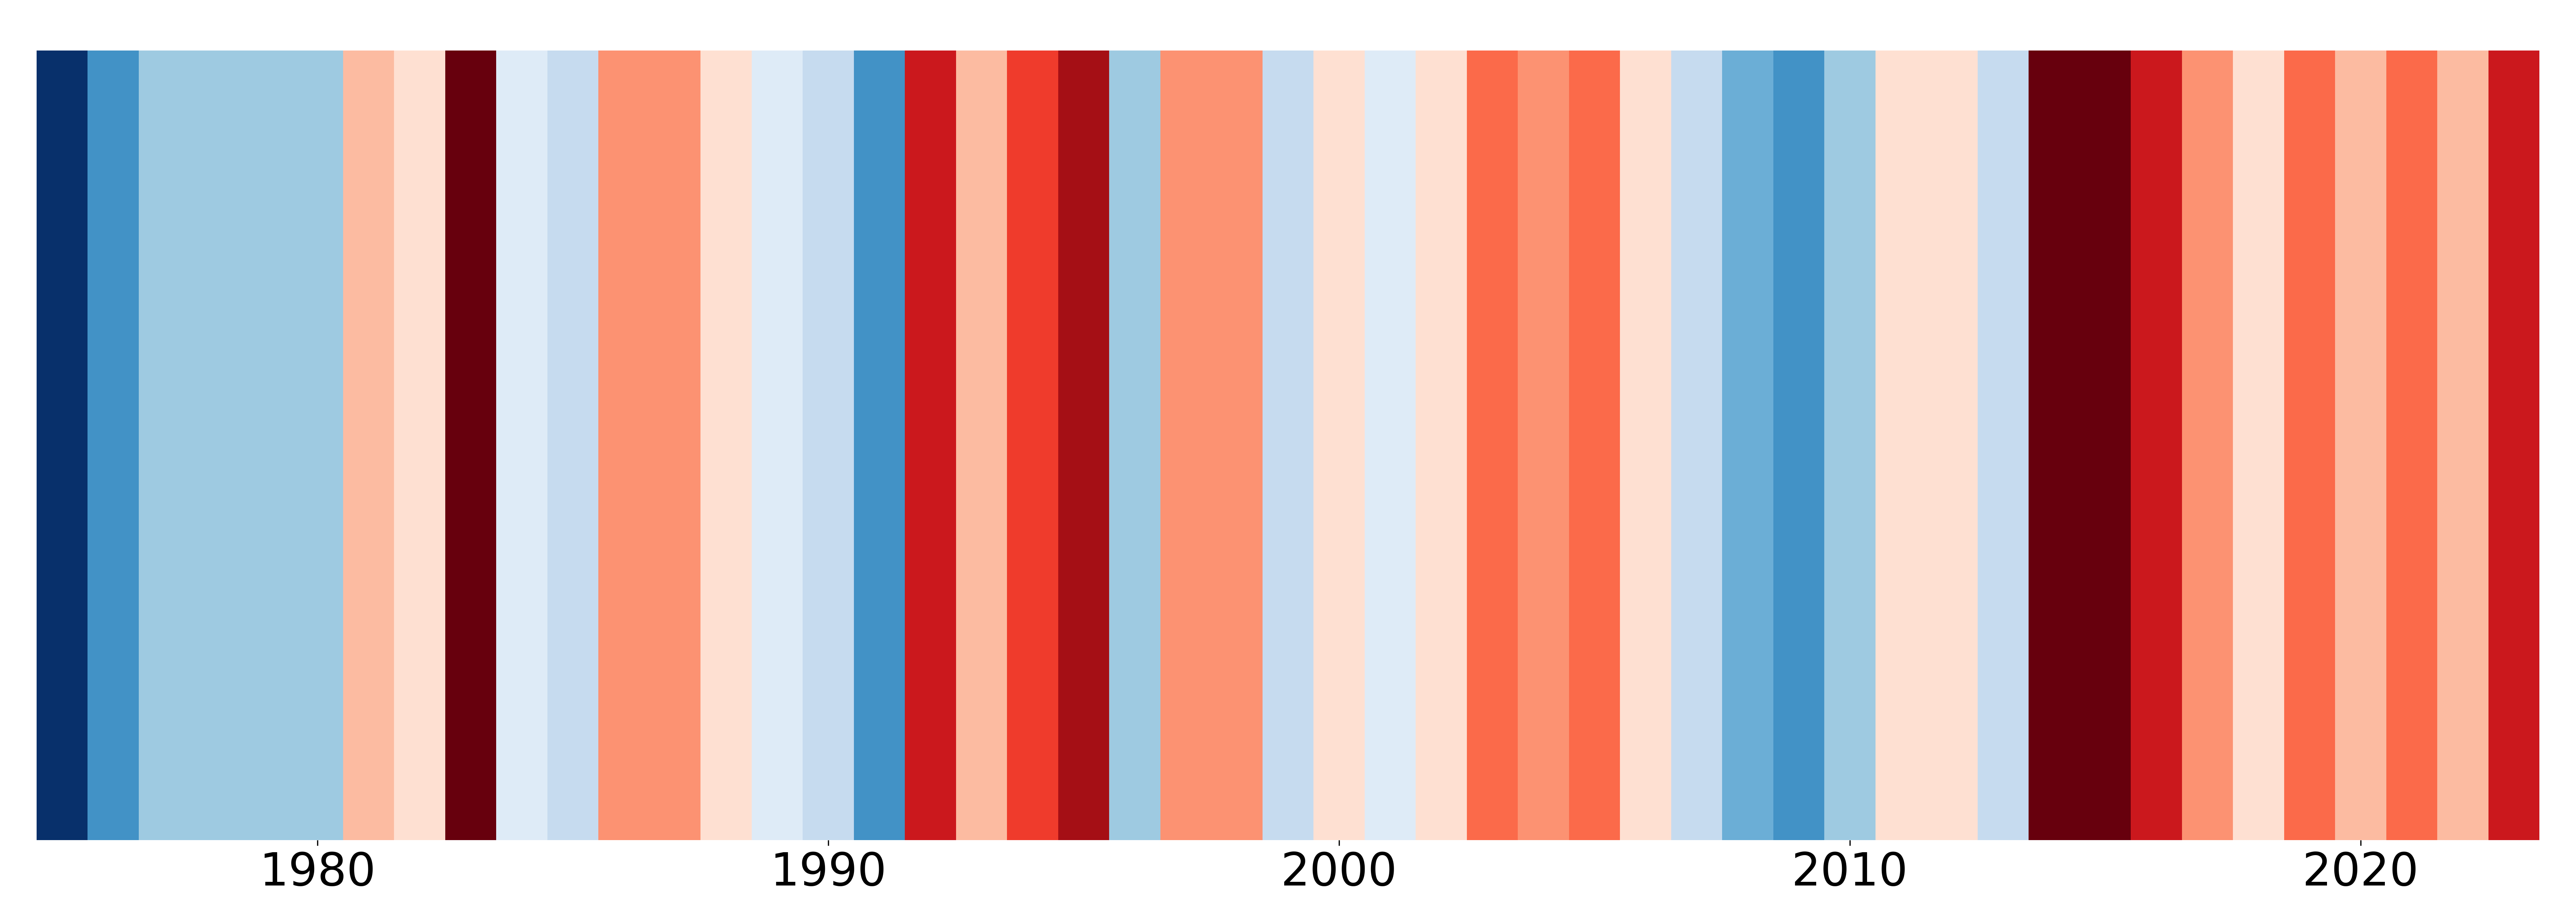
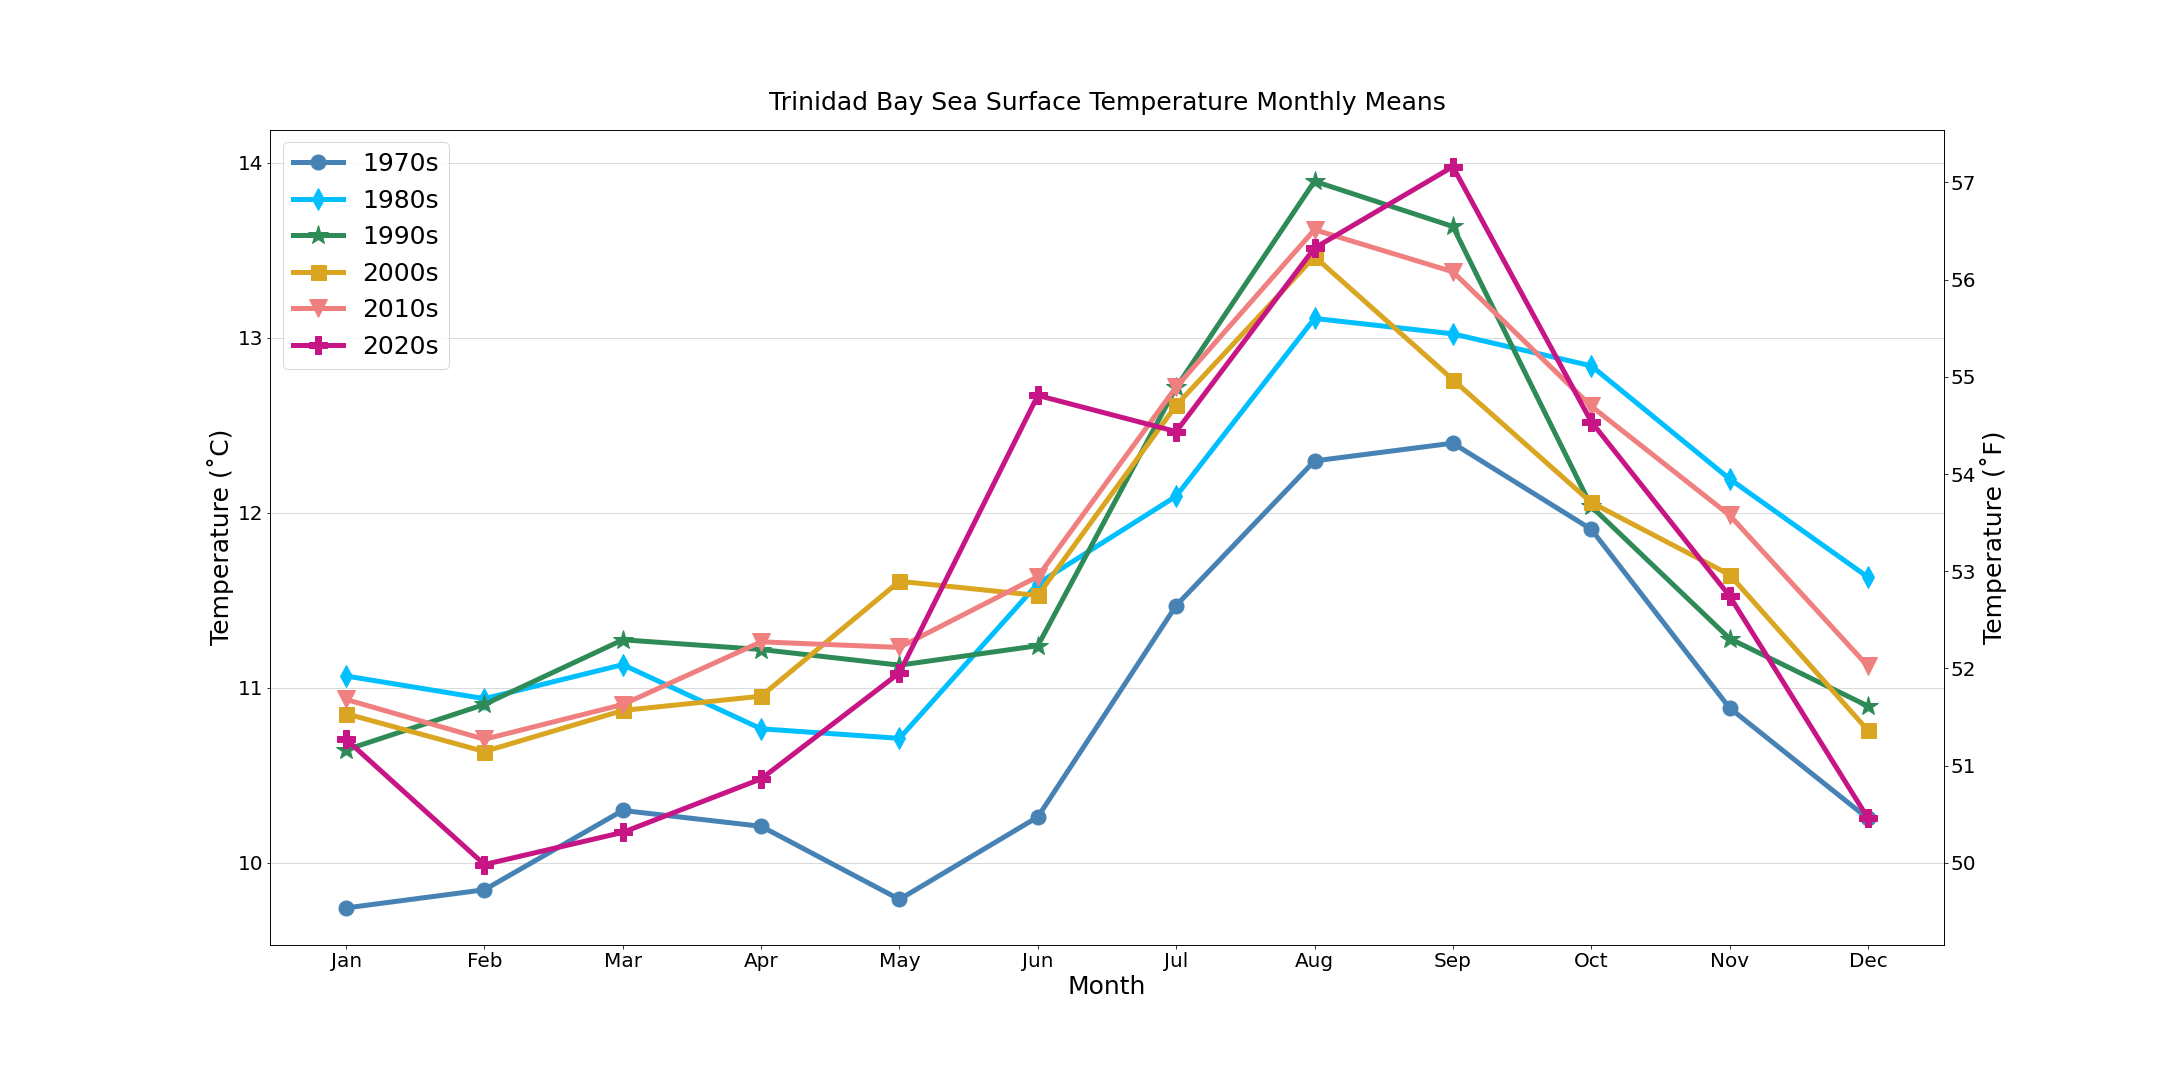
Trinidad Bay Surface Temperatures
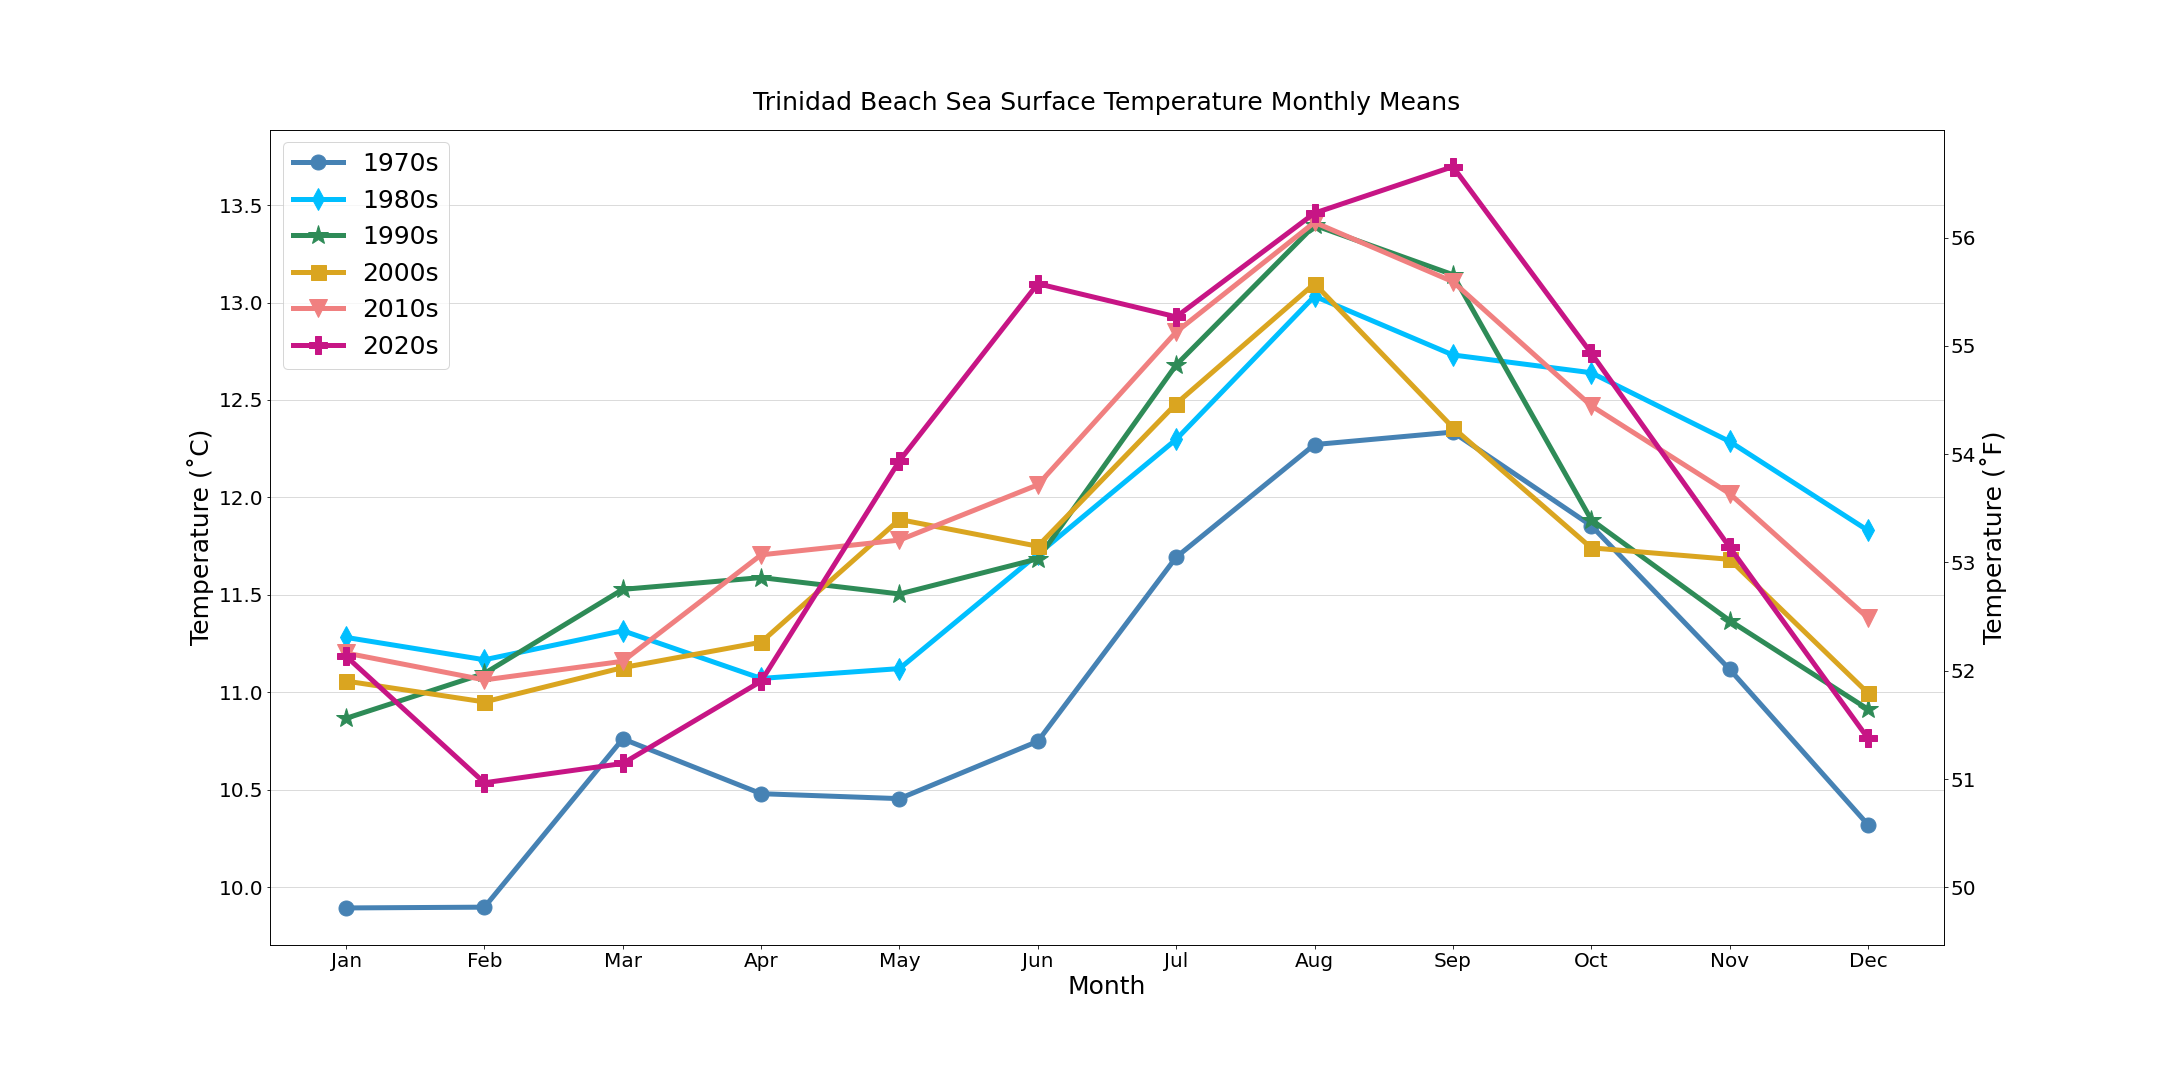
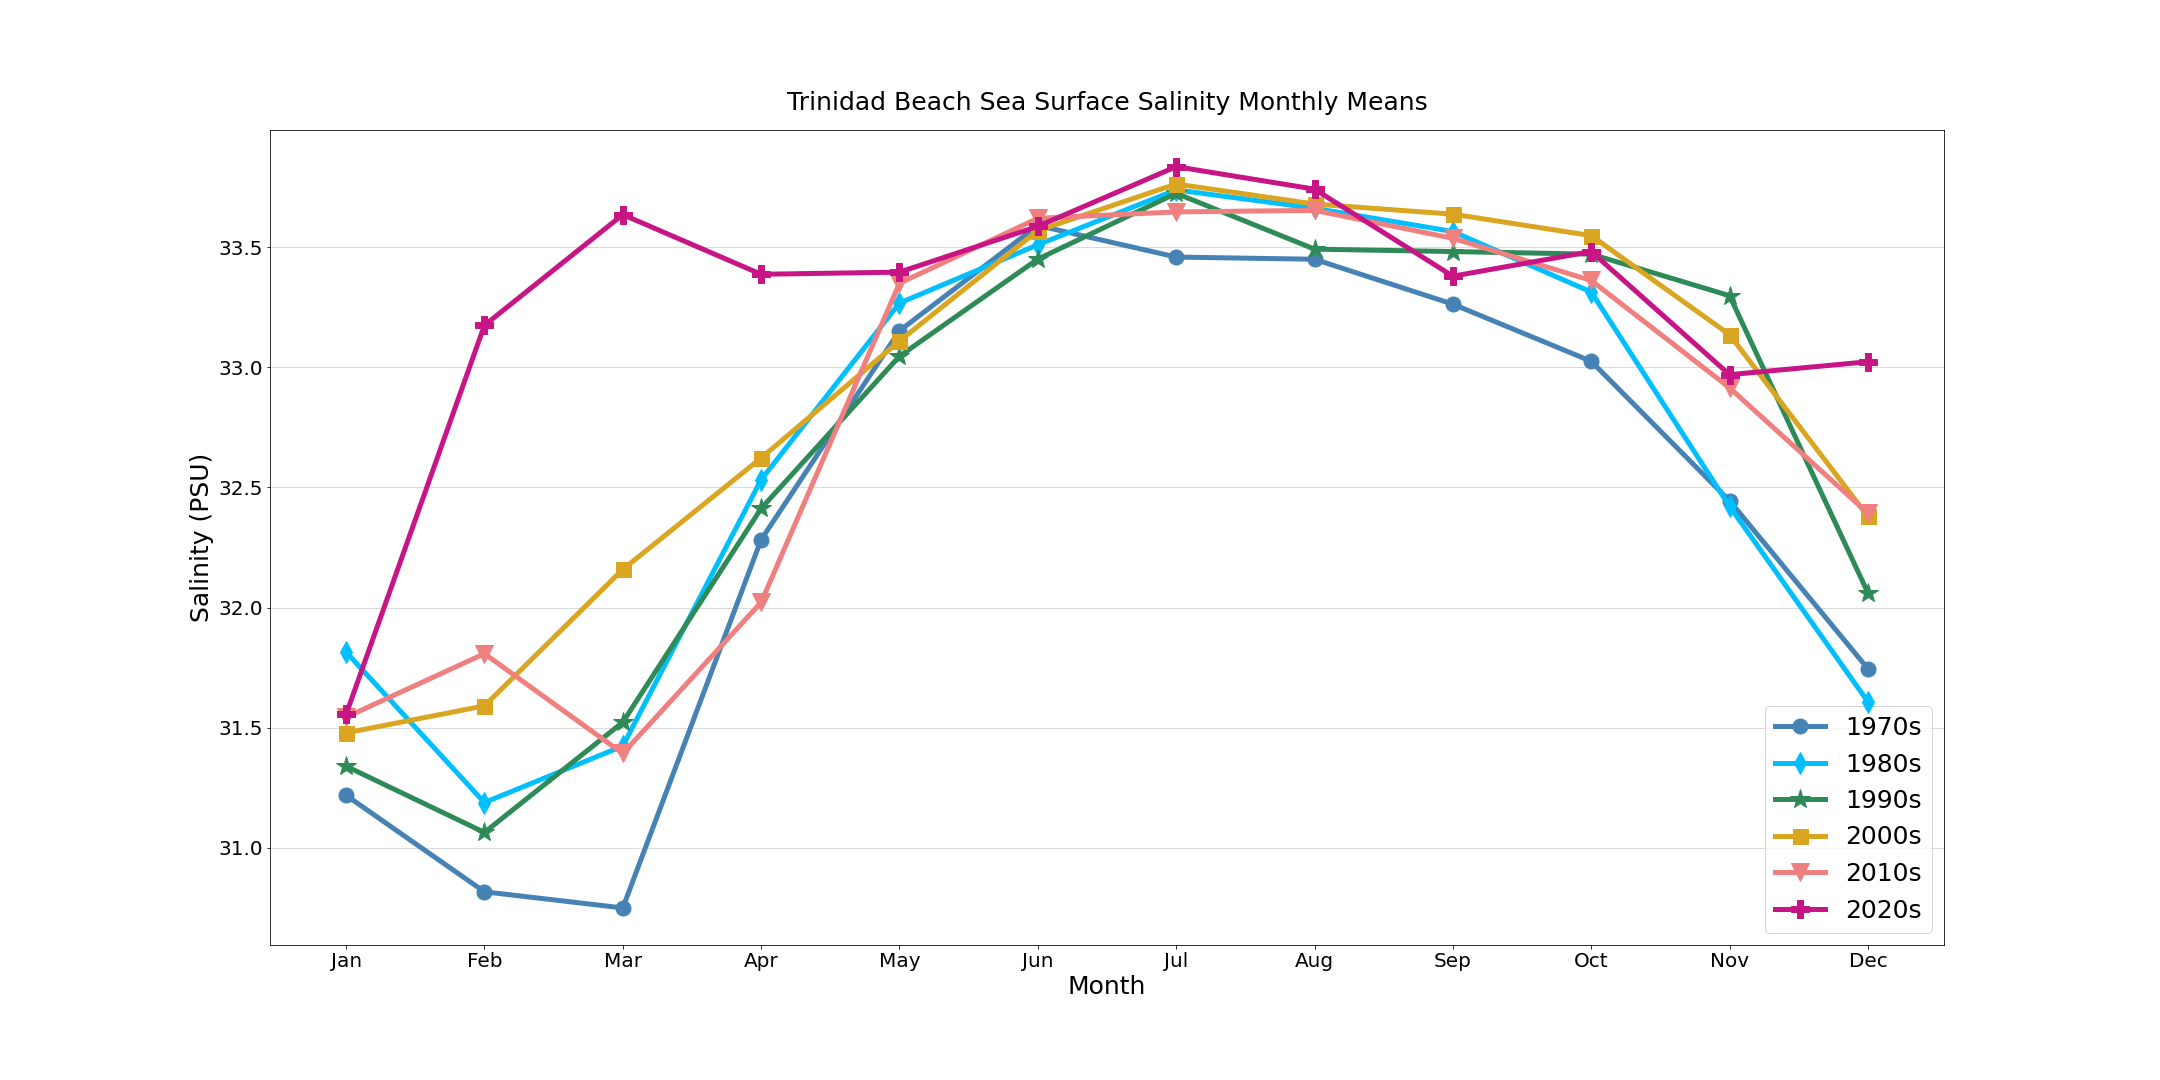
Below you can see a plot showing Monthly Sea Surface Temperature and Salinity Averages from the Trinidad Beach Shore Station, split up by decade, since 1975. You can also see a plot showing Monthly Sea Surface Temperature Averages from the Trinidad Bay Shore Station, split up by decade, since 1973.
recent data