

Note: sometimes the daily temperature is not taken


Note: sometimes the daily temperature is not taken
Total number of Shore Station samples collected at Scripps Pier:

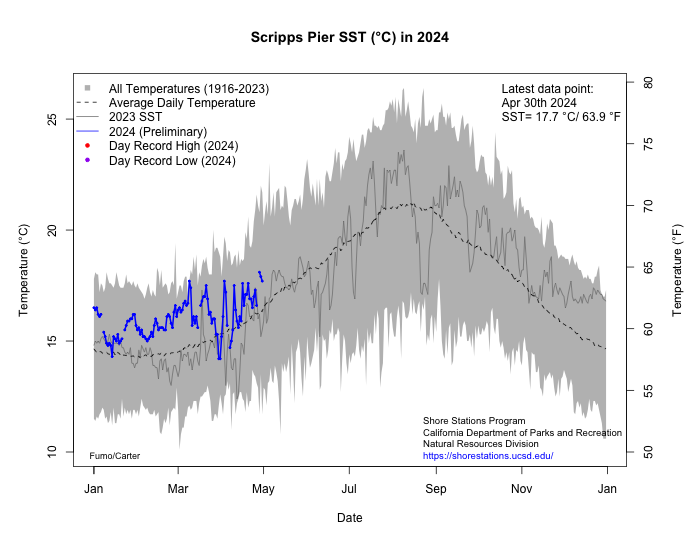
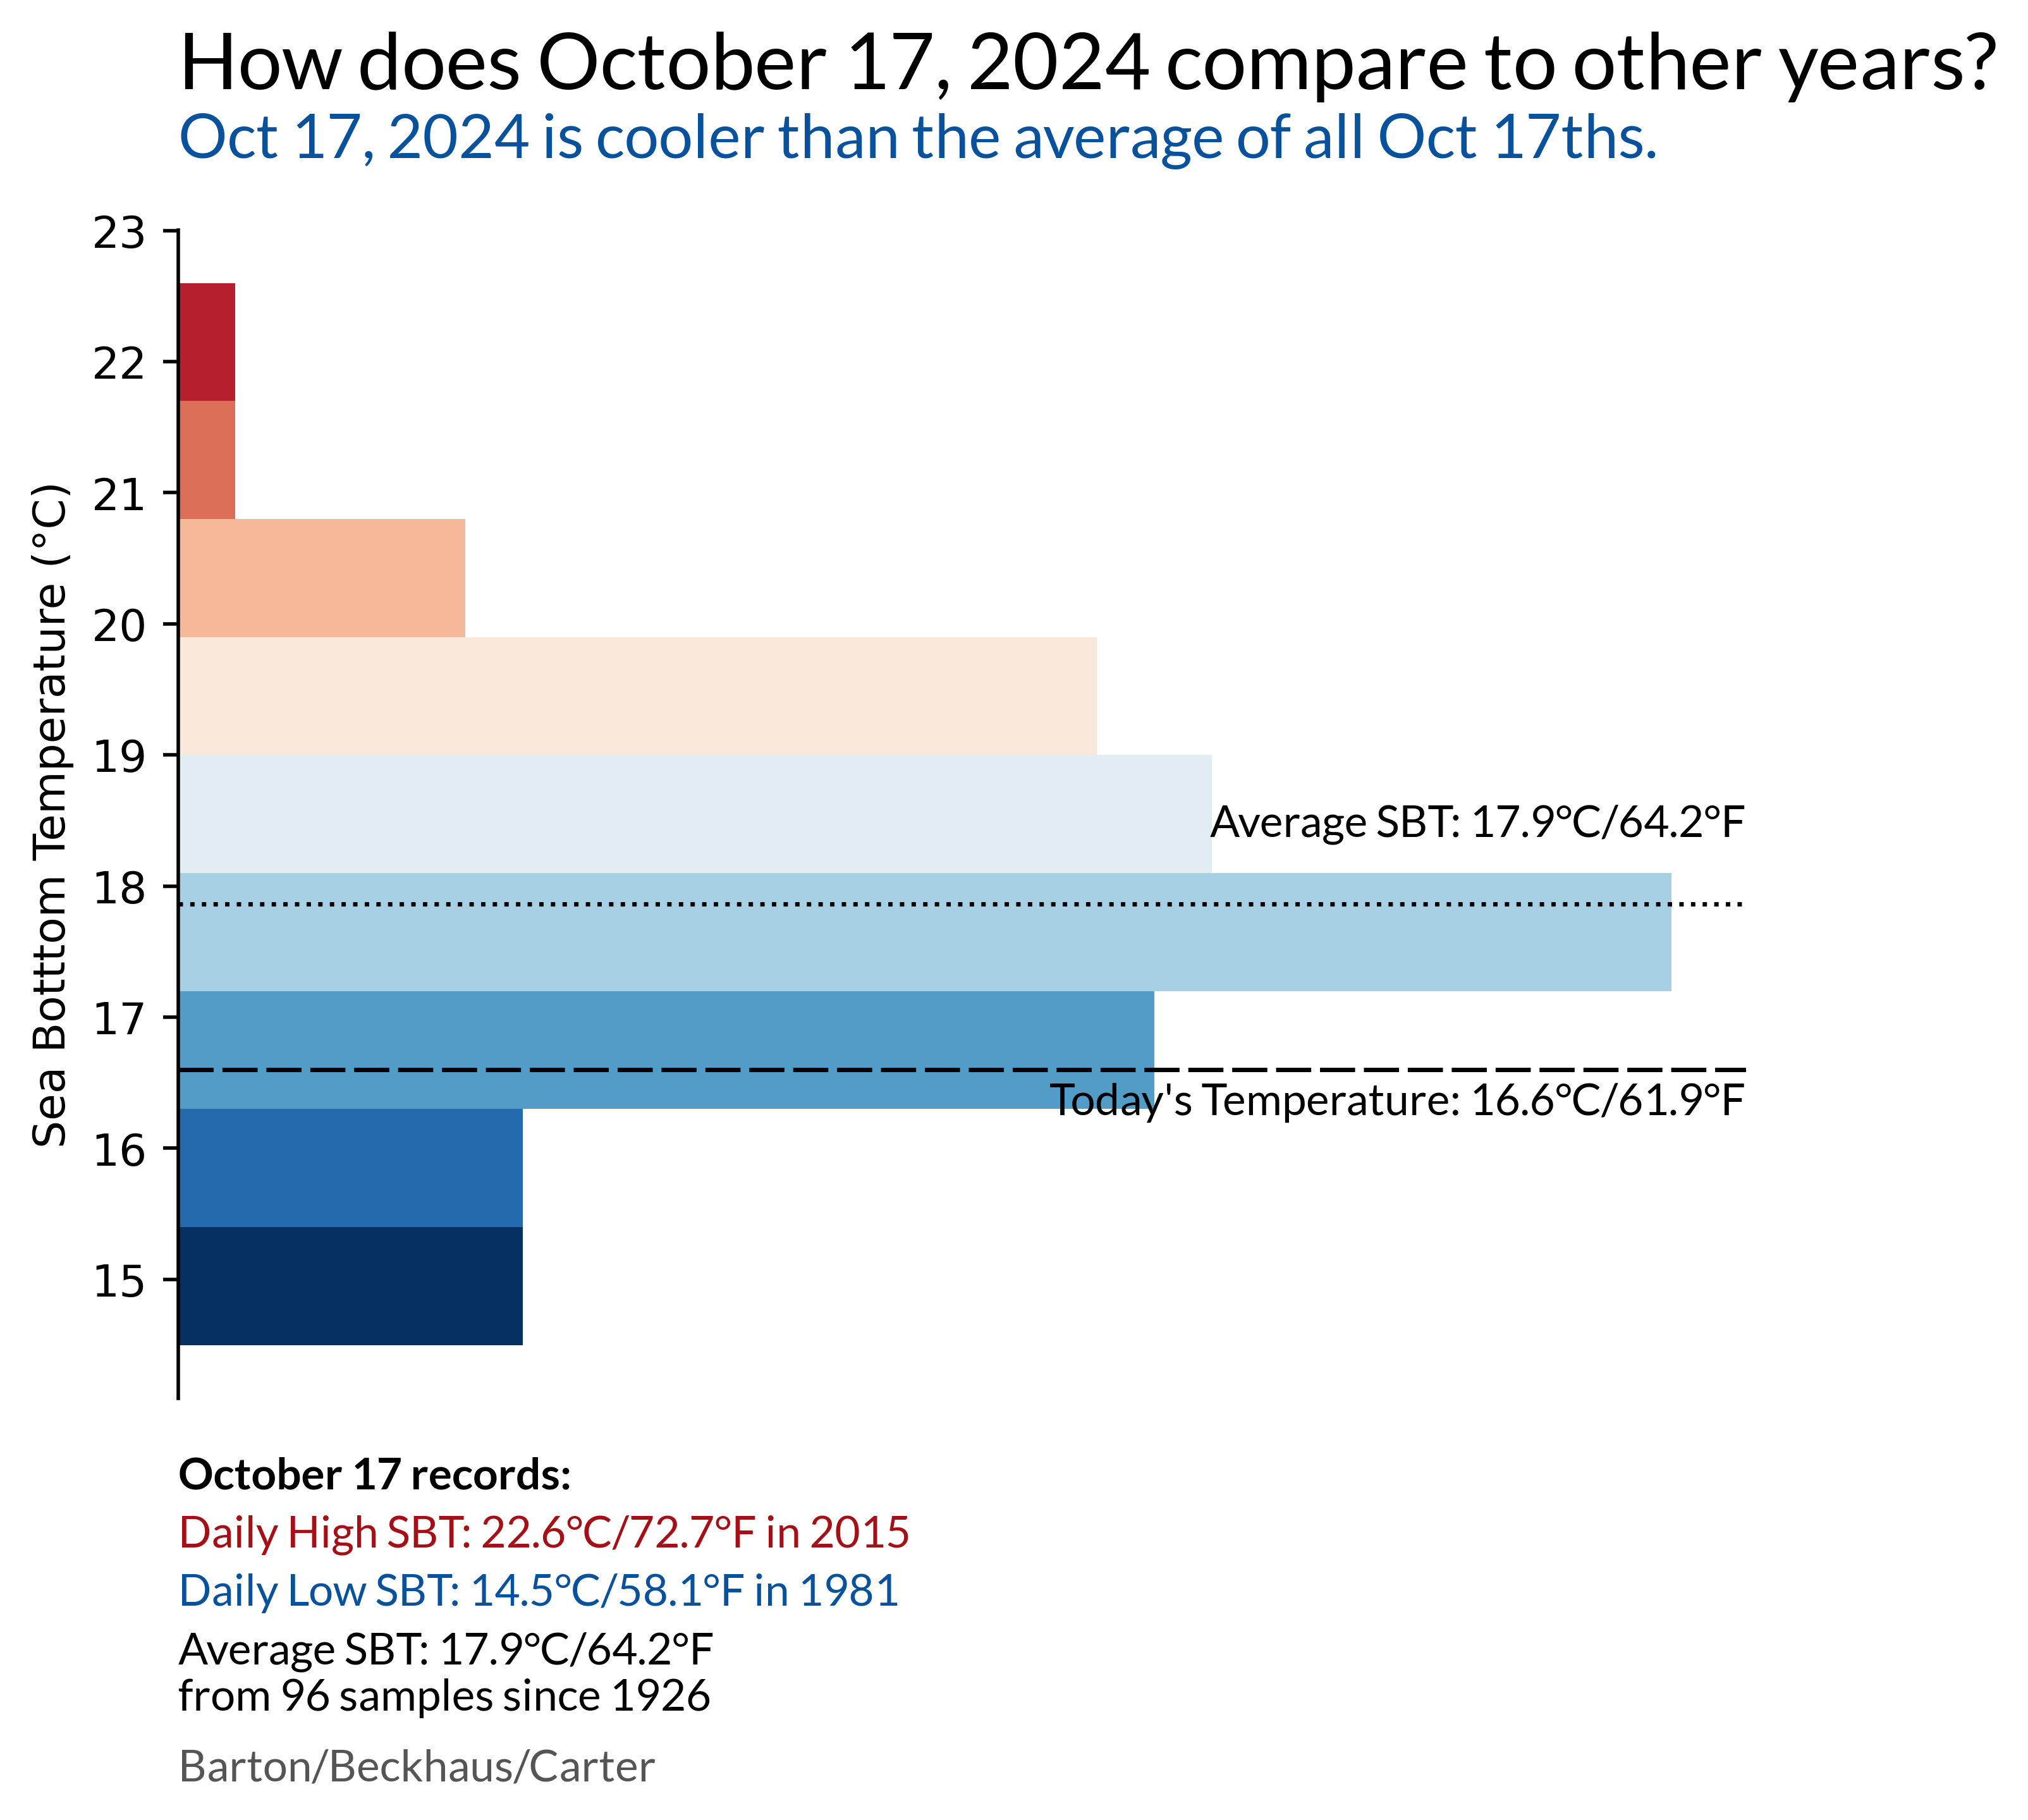
See how the daily temperature reading compares to the long term average:
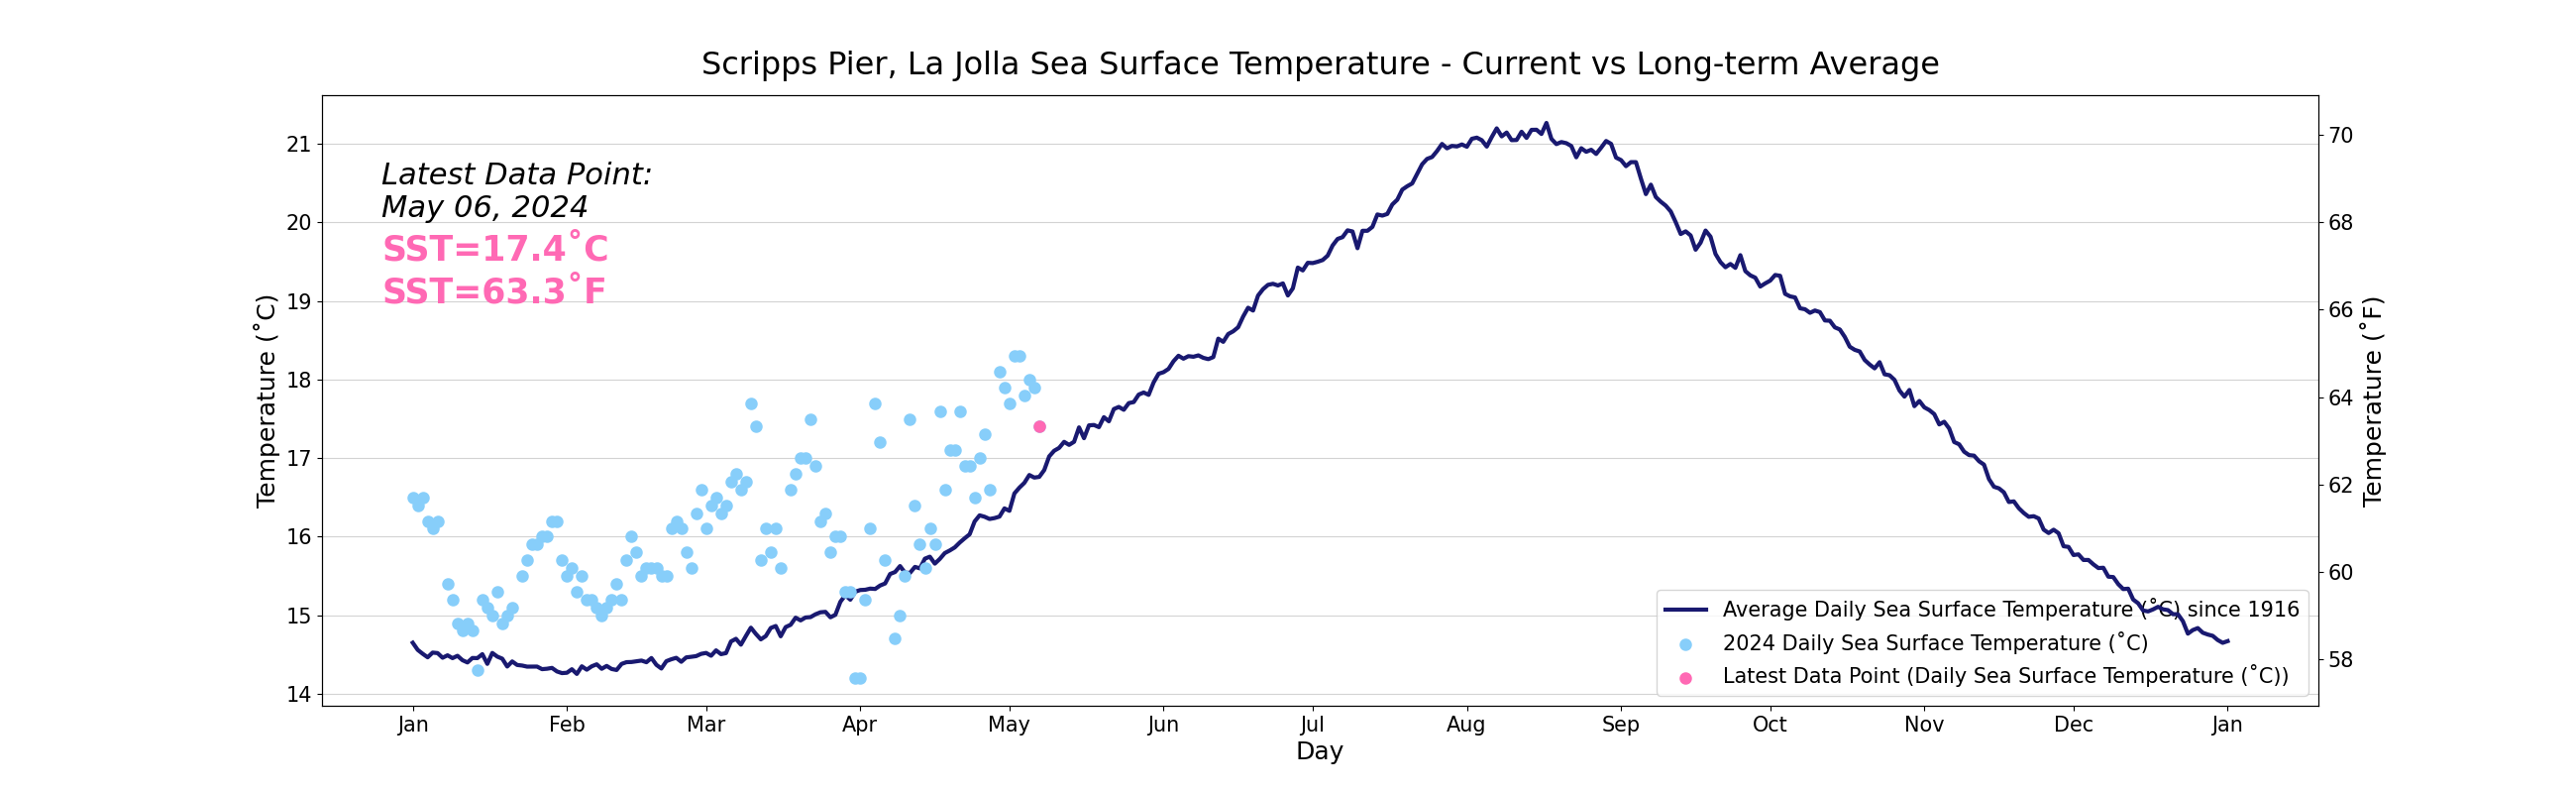
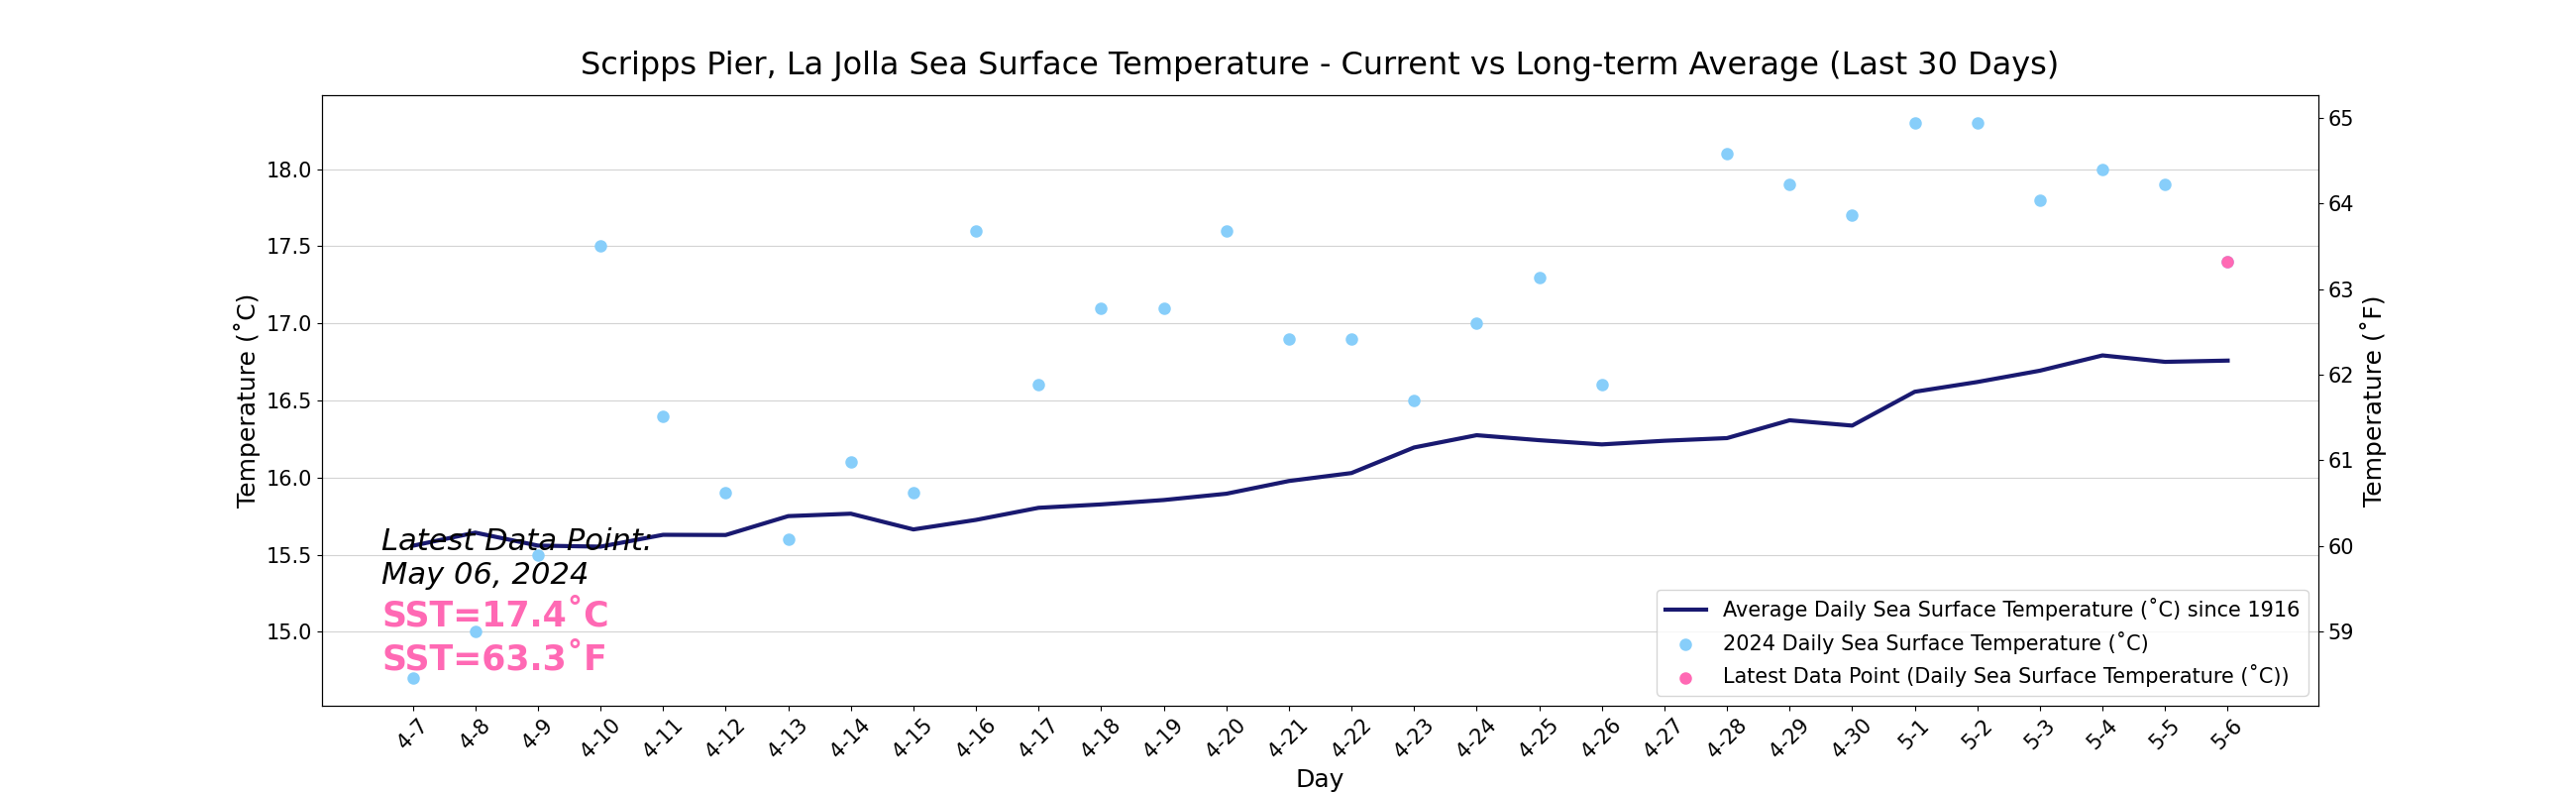
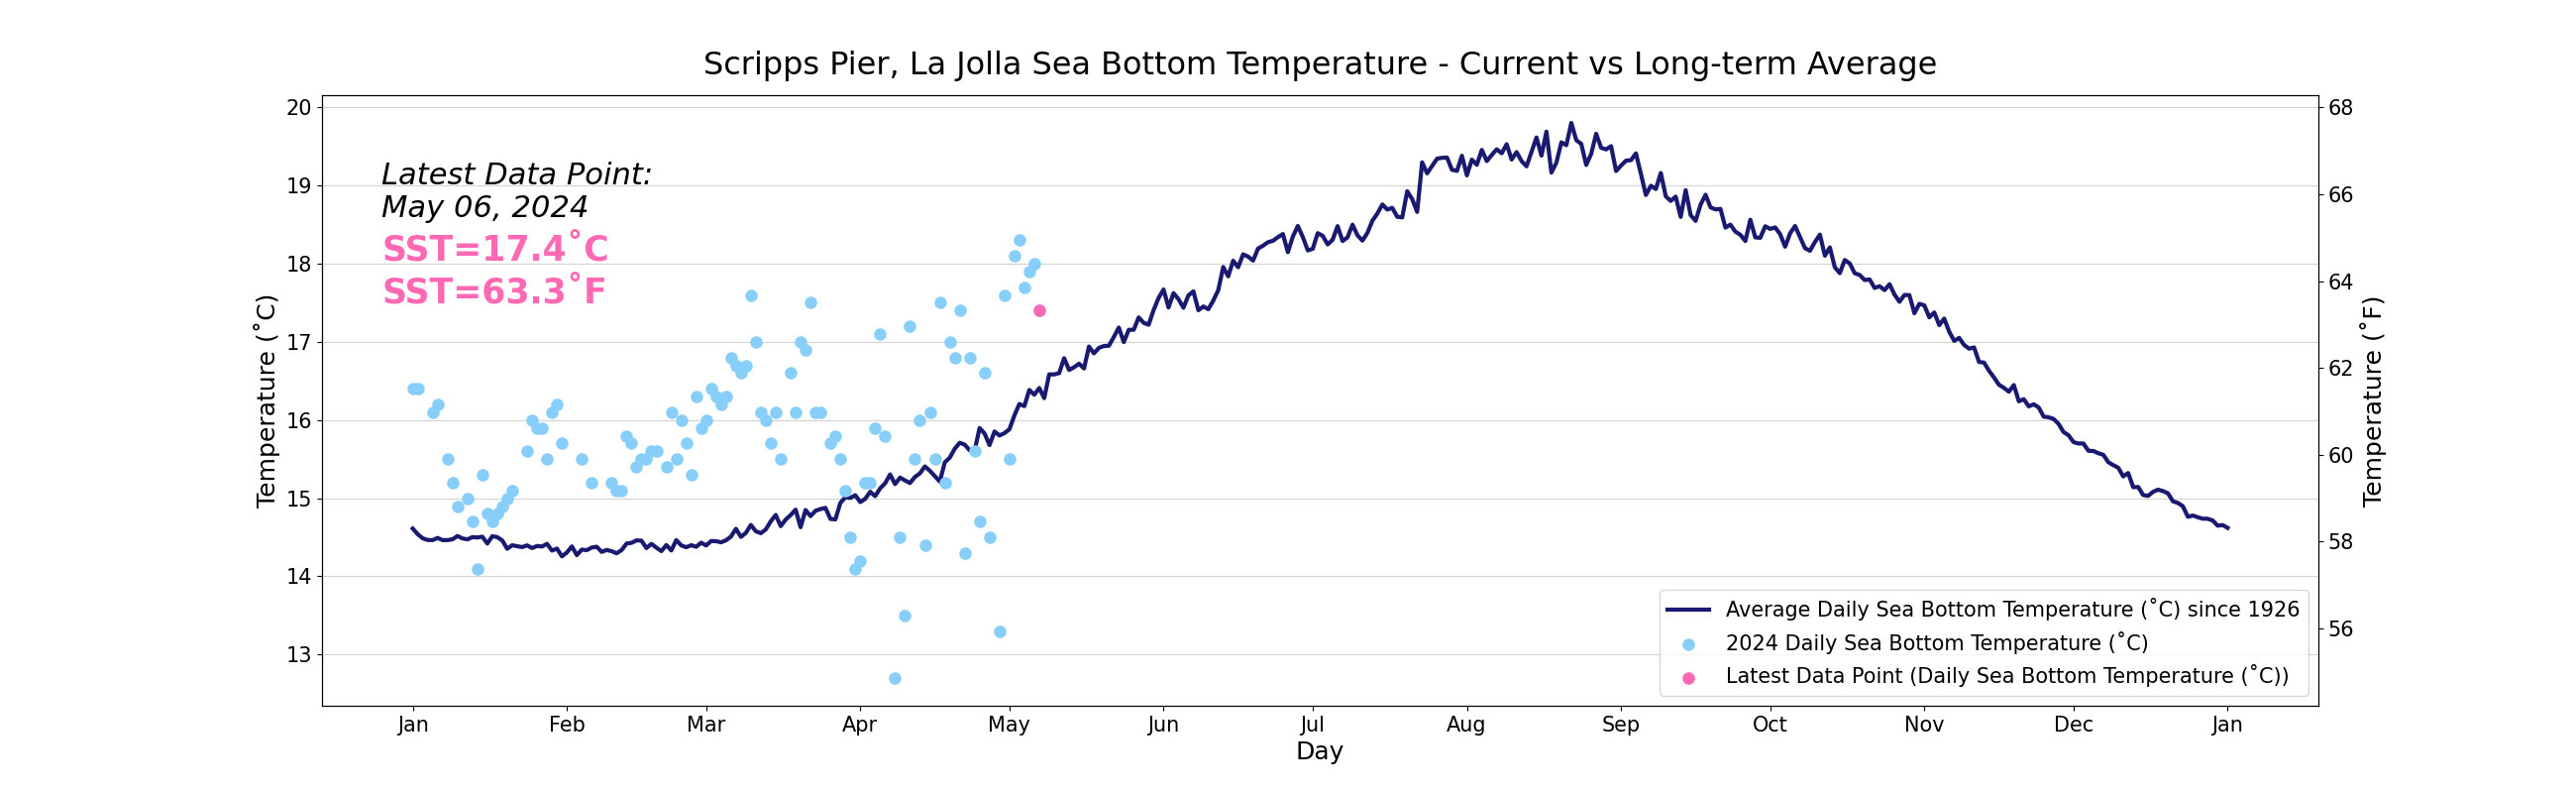
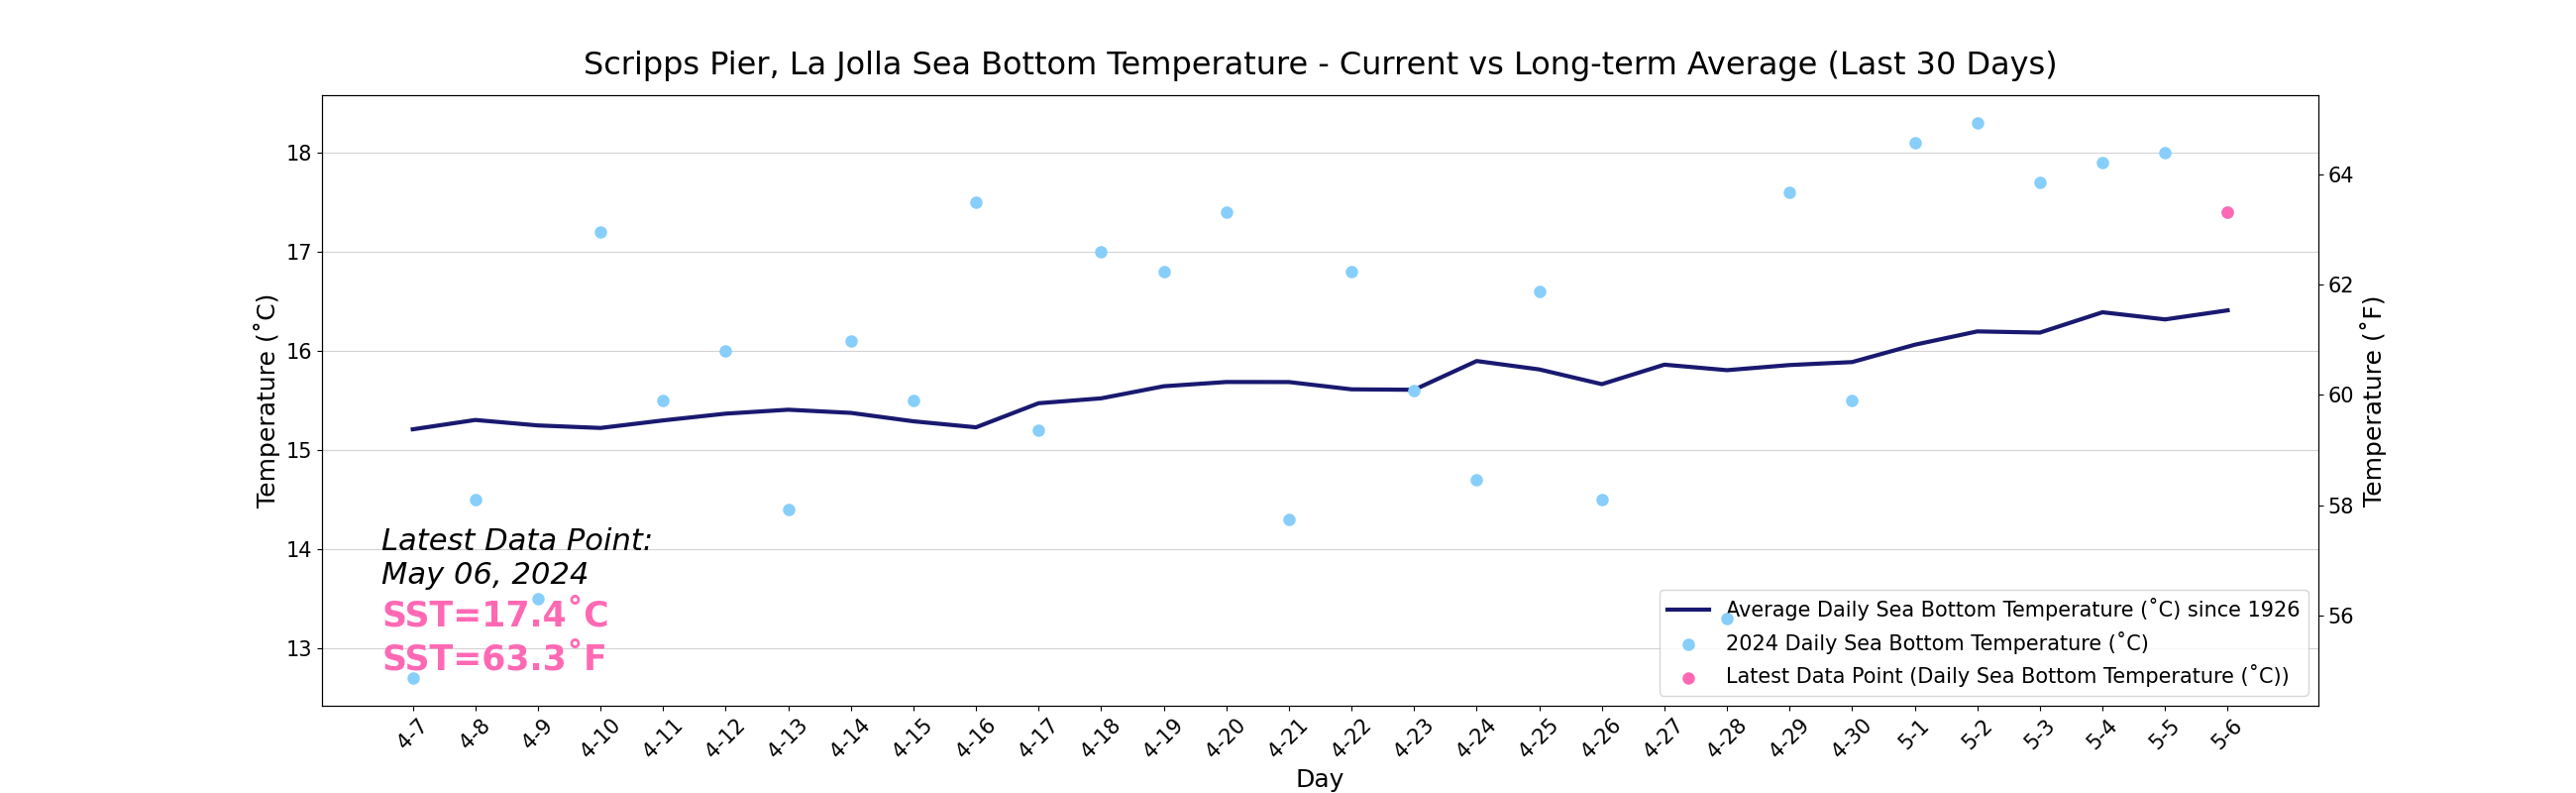

Photo by Erik Jepsen
Scripps staff, Birch aquarists, and volunteers take daily temperature and salinity samples from the end of the Scripps Pier at the sea surface and near the bottom at a depth of about 5 meters. A well extending through the base of the pier in the tide gauge room enables sampling bottles to be lowered in most weather conditions.The proximity of Scripps Pier to the deep waters at the head of La Jolla submarine canyon results in data quite representative of oceanic conditions.
Scripps Pier is a total of 1084 ft. long (330.4 M) and 22.5 ft. wide for most of its length. However it is 46.0 ft. wide at the end where the lab/pump house structure is situated with the west wall standing 88.0 ft. from the end of the pier (=996 ft. from the shore). The orientation is 277 / 97 degrees magnetic, 14 degrees East variation. The deck of the pier is 33.5 ft. above Mean Low Low Water (MLLW).
CLICK HERE TO ACCESS Scripps pier, la jolla DATA FROM 1916-CURRENT
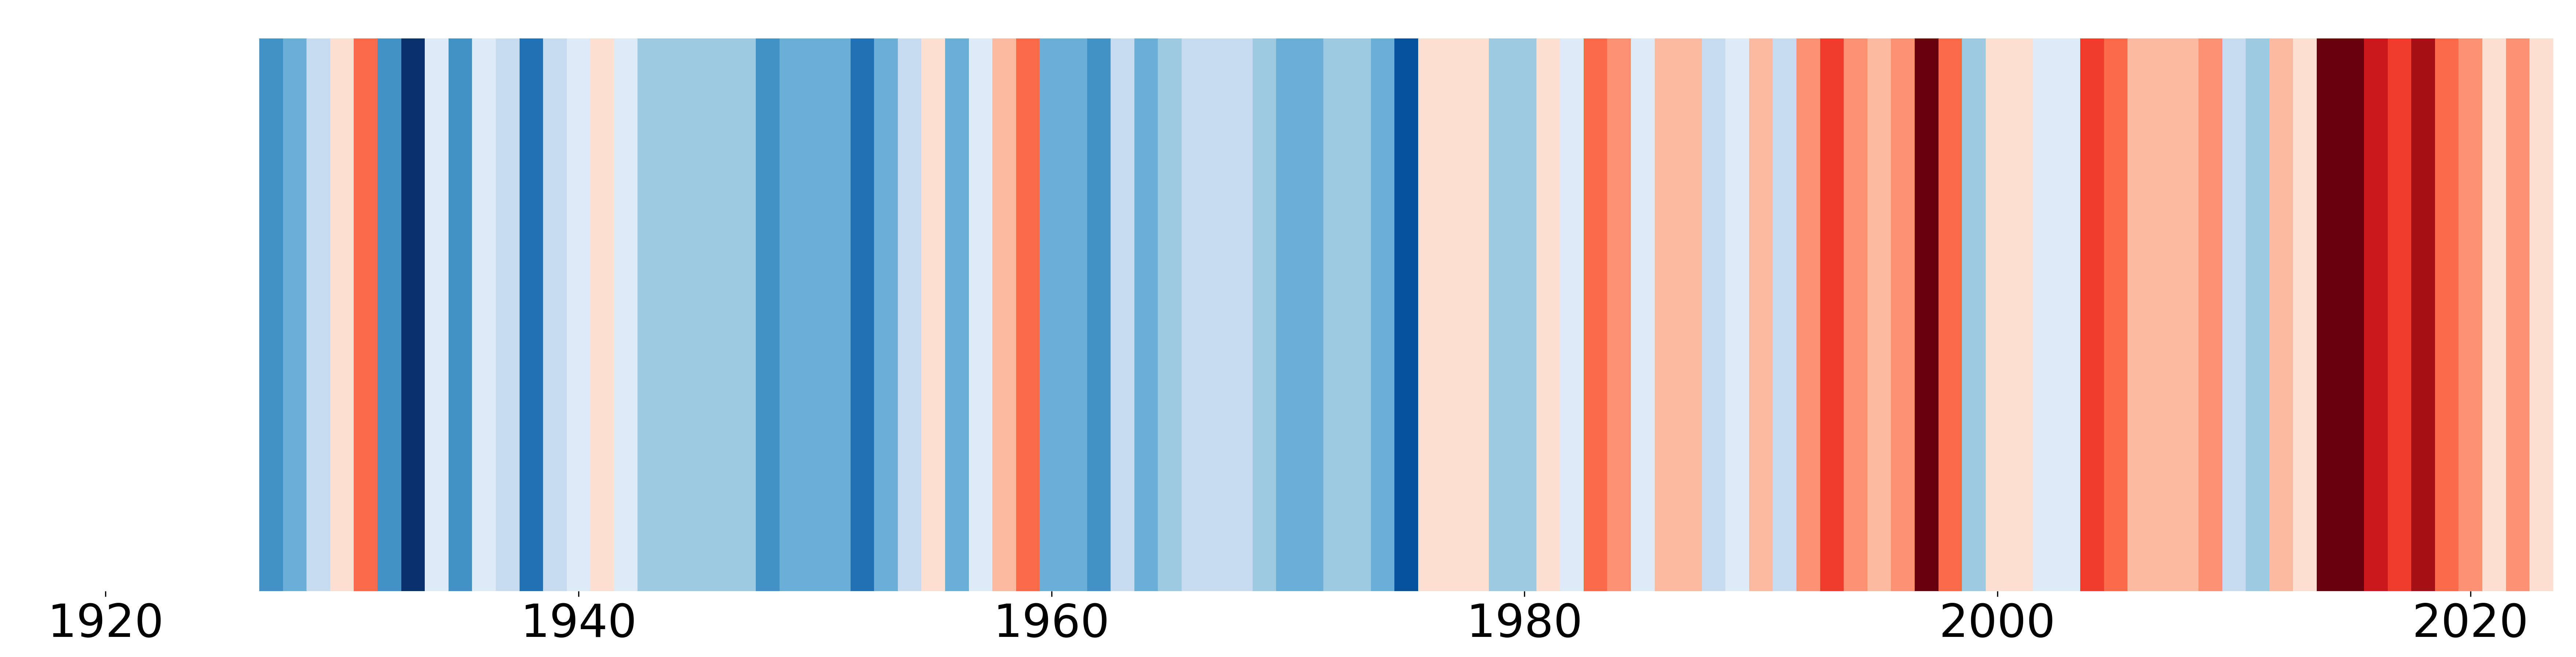
Below are figures that we have modeled after the #ShowYourStripes Campaign (created by Ed Hawkins), to help us visualize how sea surface and bottom temperature have changed at the Scripps Pier in La Jolla since 1916 and 1926, respectively. The change in temperature is relative to the average temperature calculated between 1916-2023 (surface) and 1926-2023 (bottom).
Scripps Pier Surface Temperatures
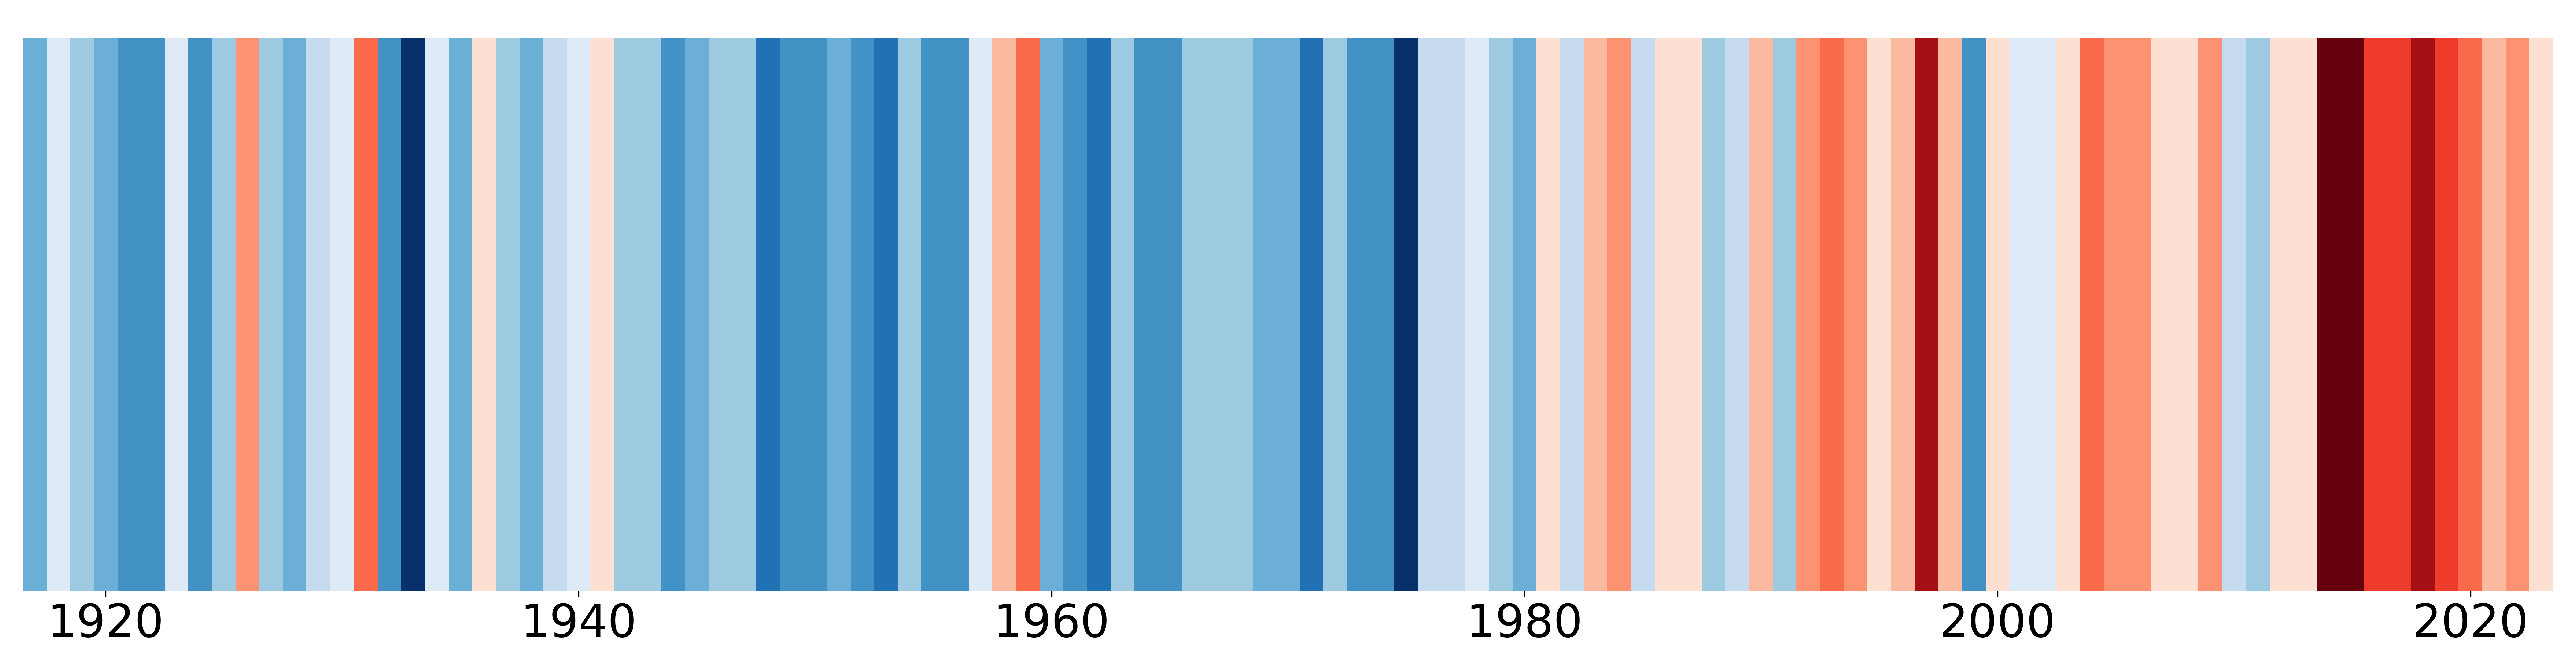
Scripps Pier Bottom Temperatures
Shore Station temperature indices from Scripps Pier are being used to provide historical context for understanding large-scale physical phenomena like El Niño–Southern Oscillation events
The Spray data team, who is part of the Instrument Development Group at Scripps Institution of Oceanography, developed the California Underwater Glider Network (CUGN) in 2005 to monitor the effects of El Niño in the California Current System (CCS). They use their glider measurements of the CCS to create the Southern California Temperature Index (SCTI). The Scripps Pier Shore Station data provides historical context for the glider temperature measurements. The plot below, created by the Spray data team, shows the overlap of Shore Station temperature data and glider temperature data. Learn more about the work the Spray data team is doing with El Niño here.

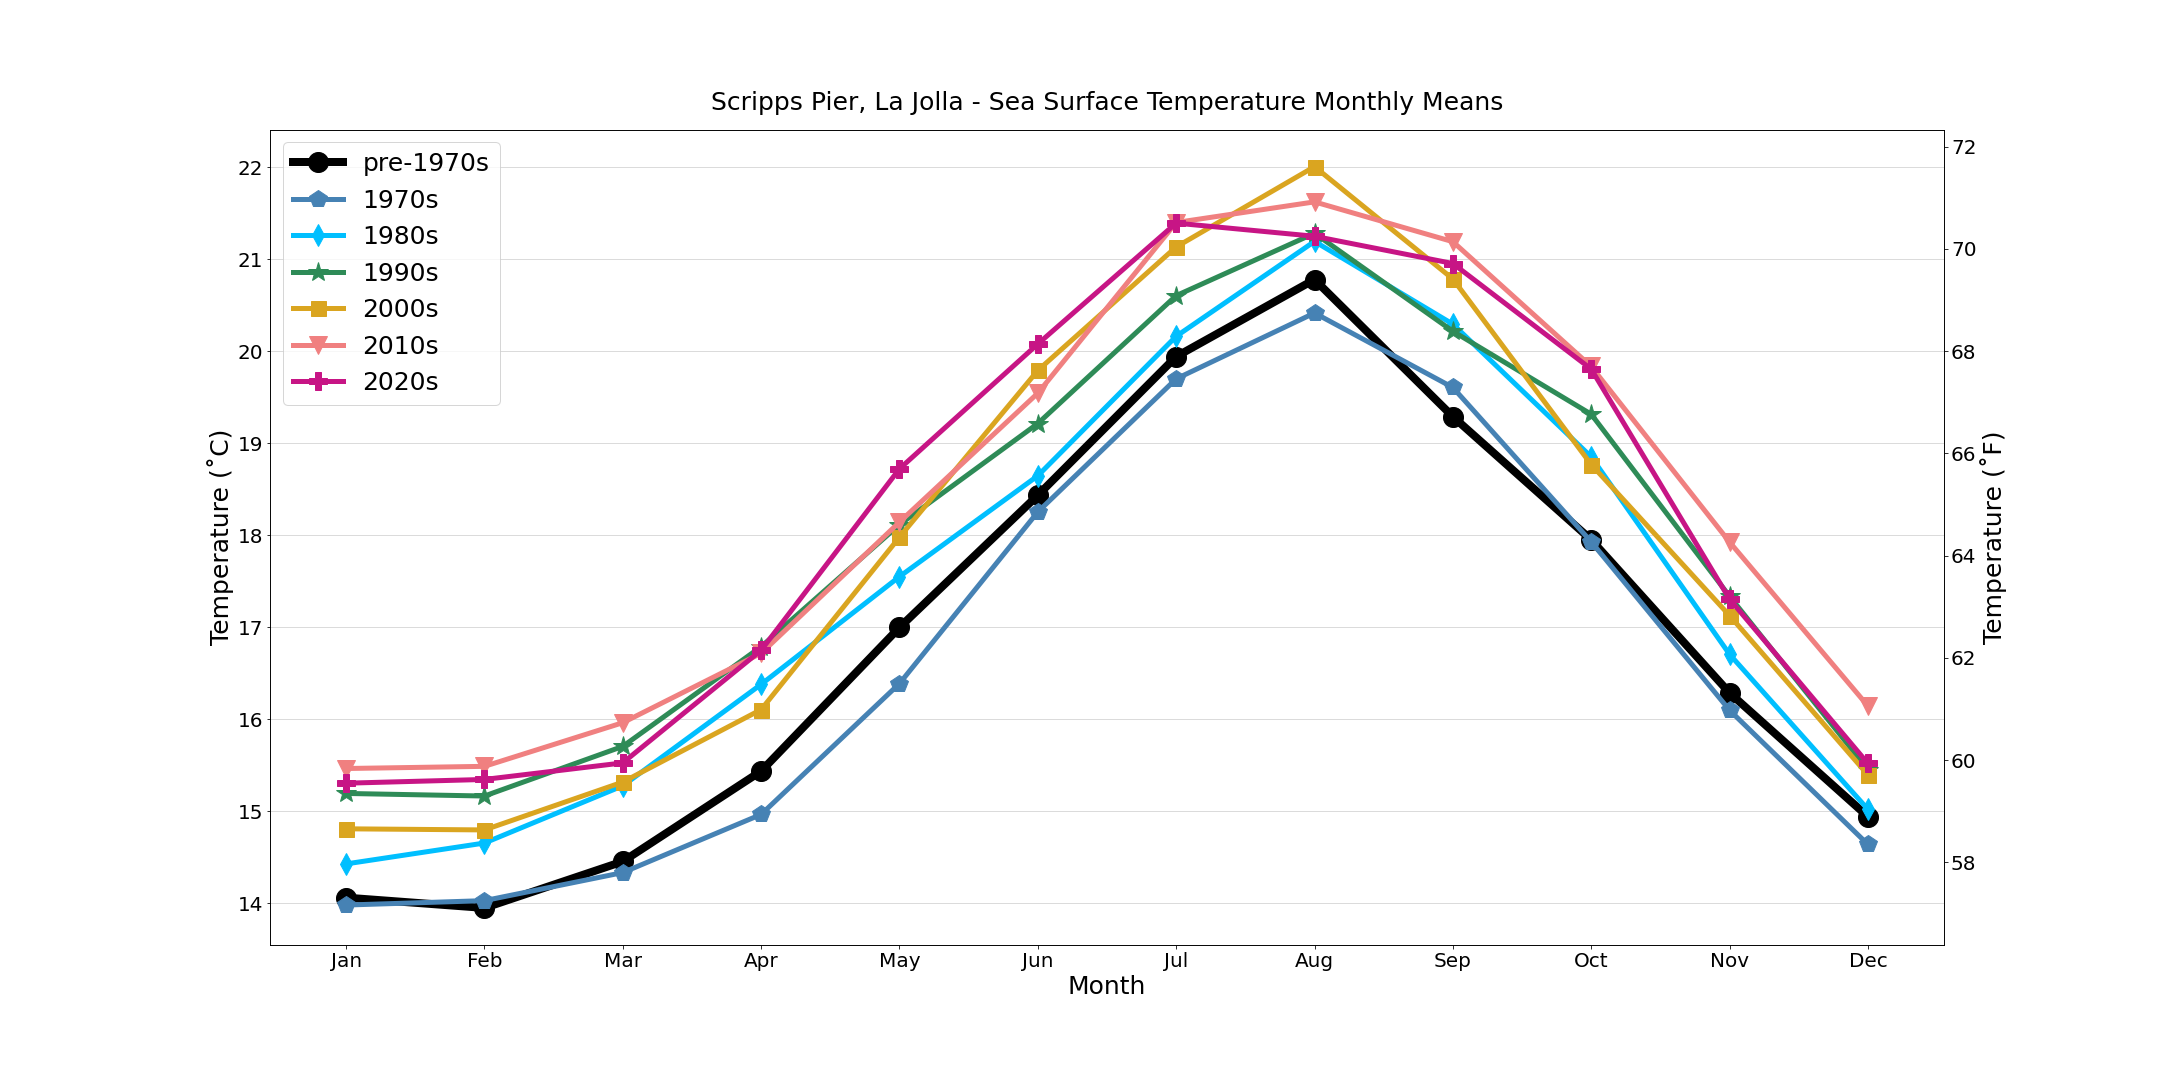
Below you can see a plot showing Monthly Sea Surface Temperature Averages from the Scripps Pier, La Jolla Shore Station, split up by decade, since 1970.
Recent Data