

Note: sometimes the daily temperature is not taken

Total number of Shore Station samples collected at Newport Pier:

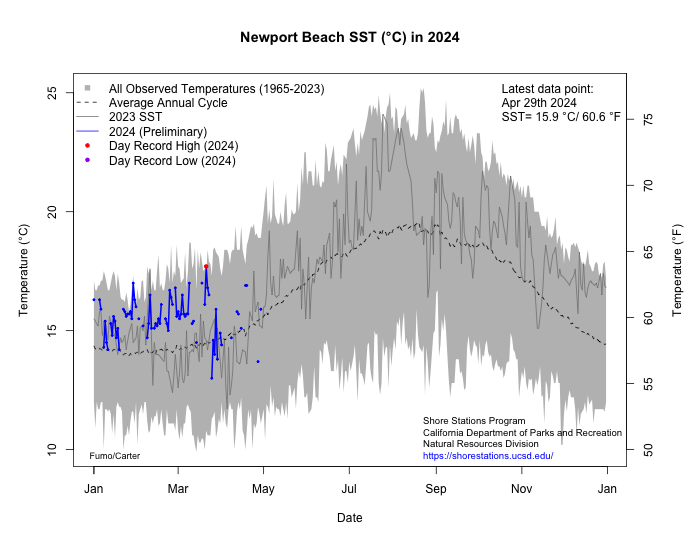
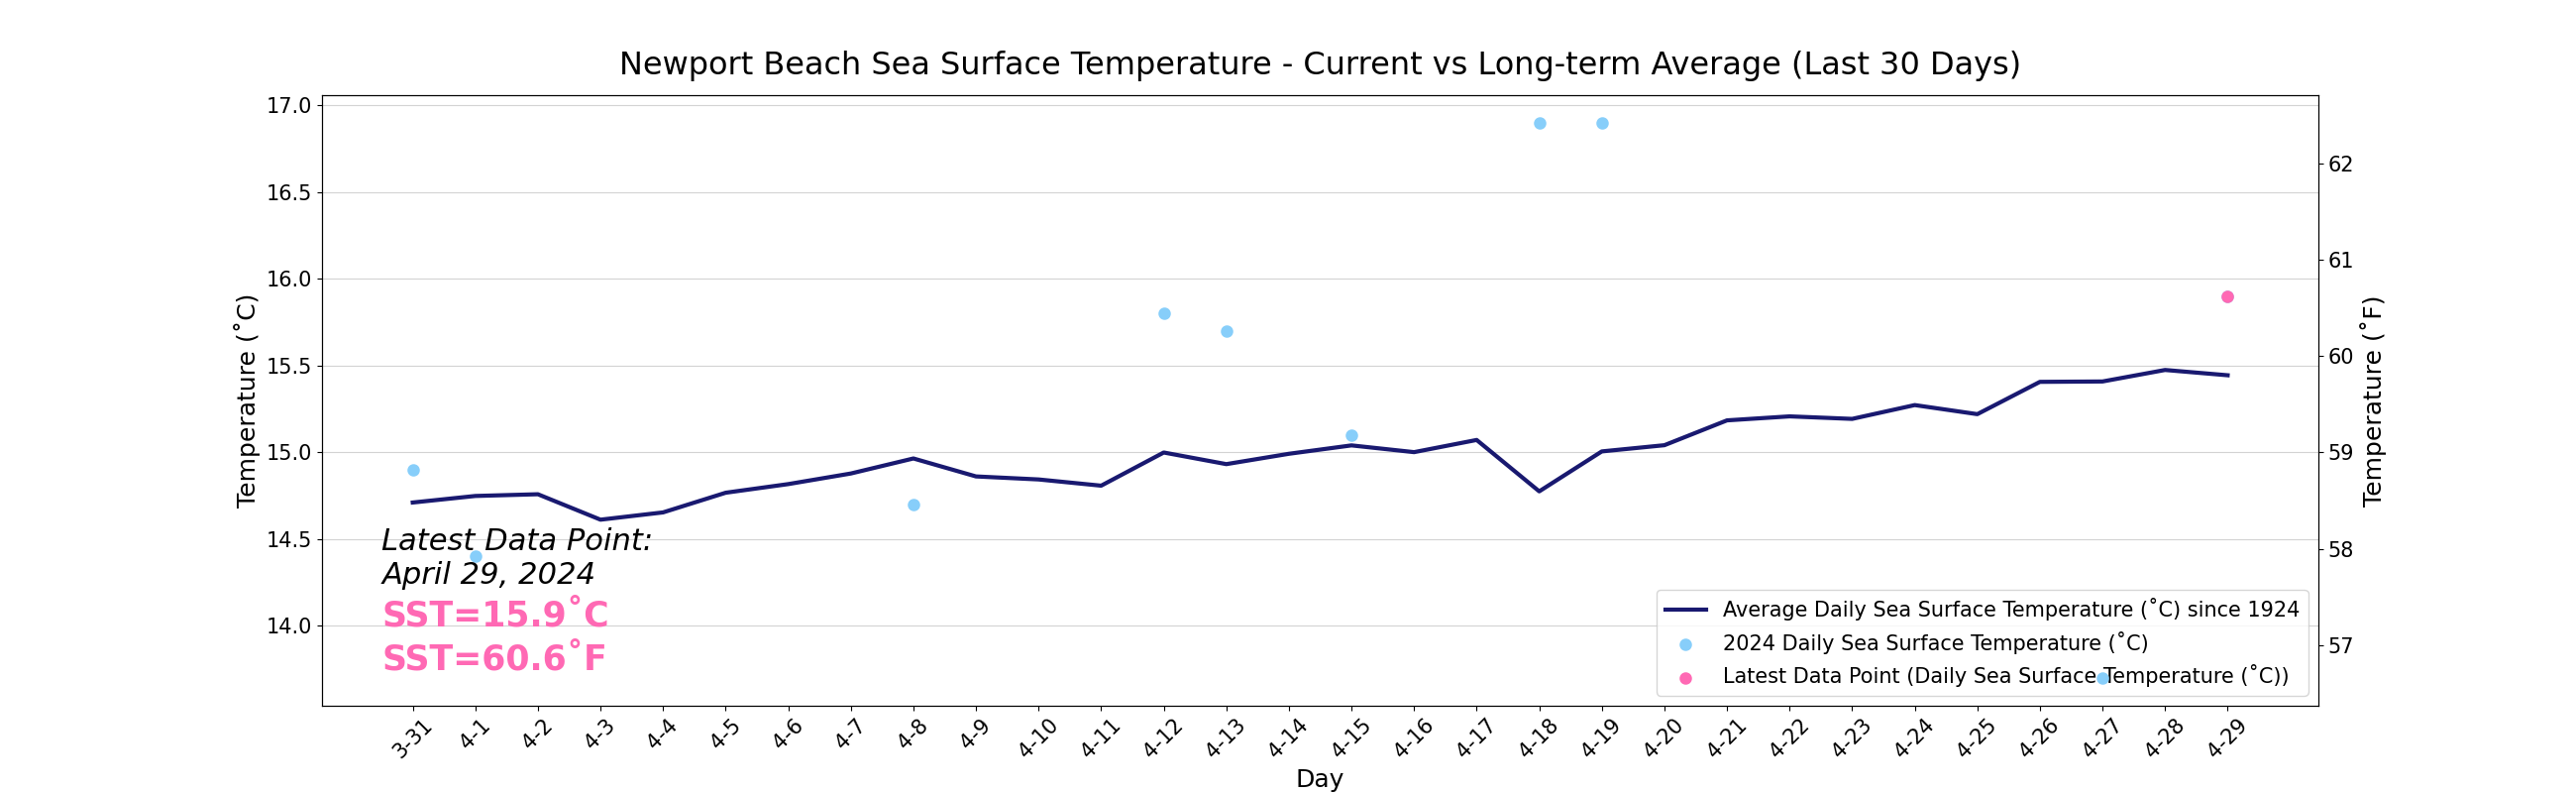
See how the daily temperature reading compares to the long term average:
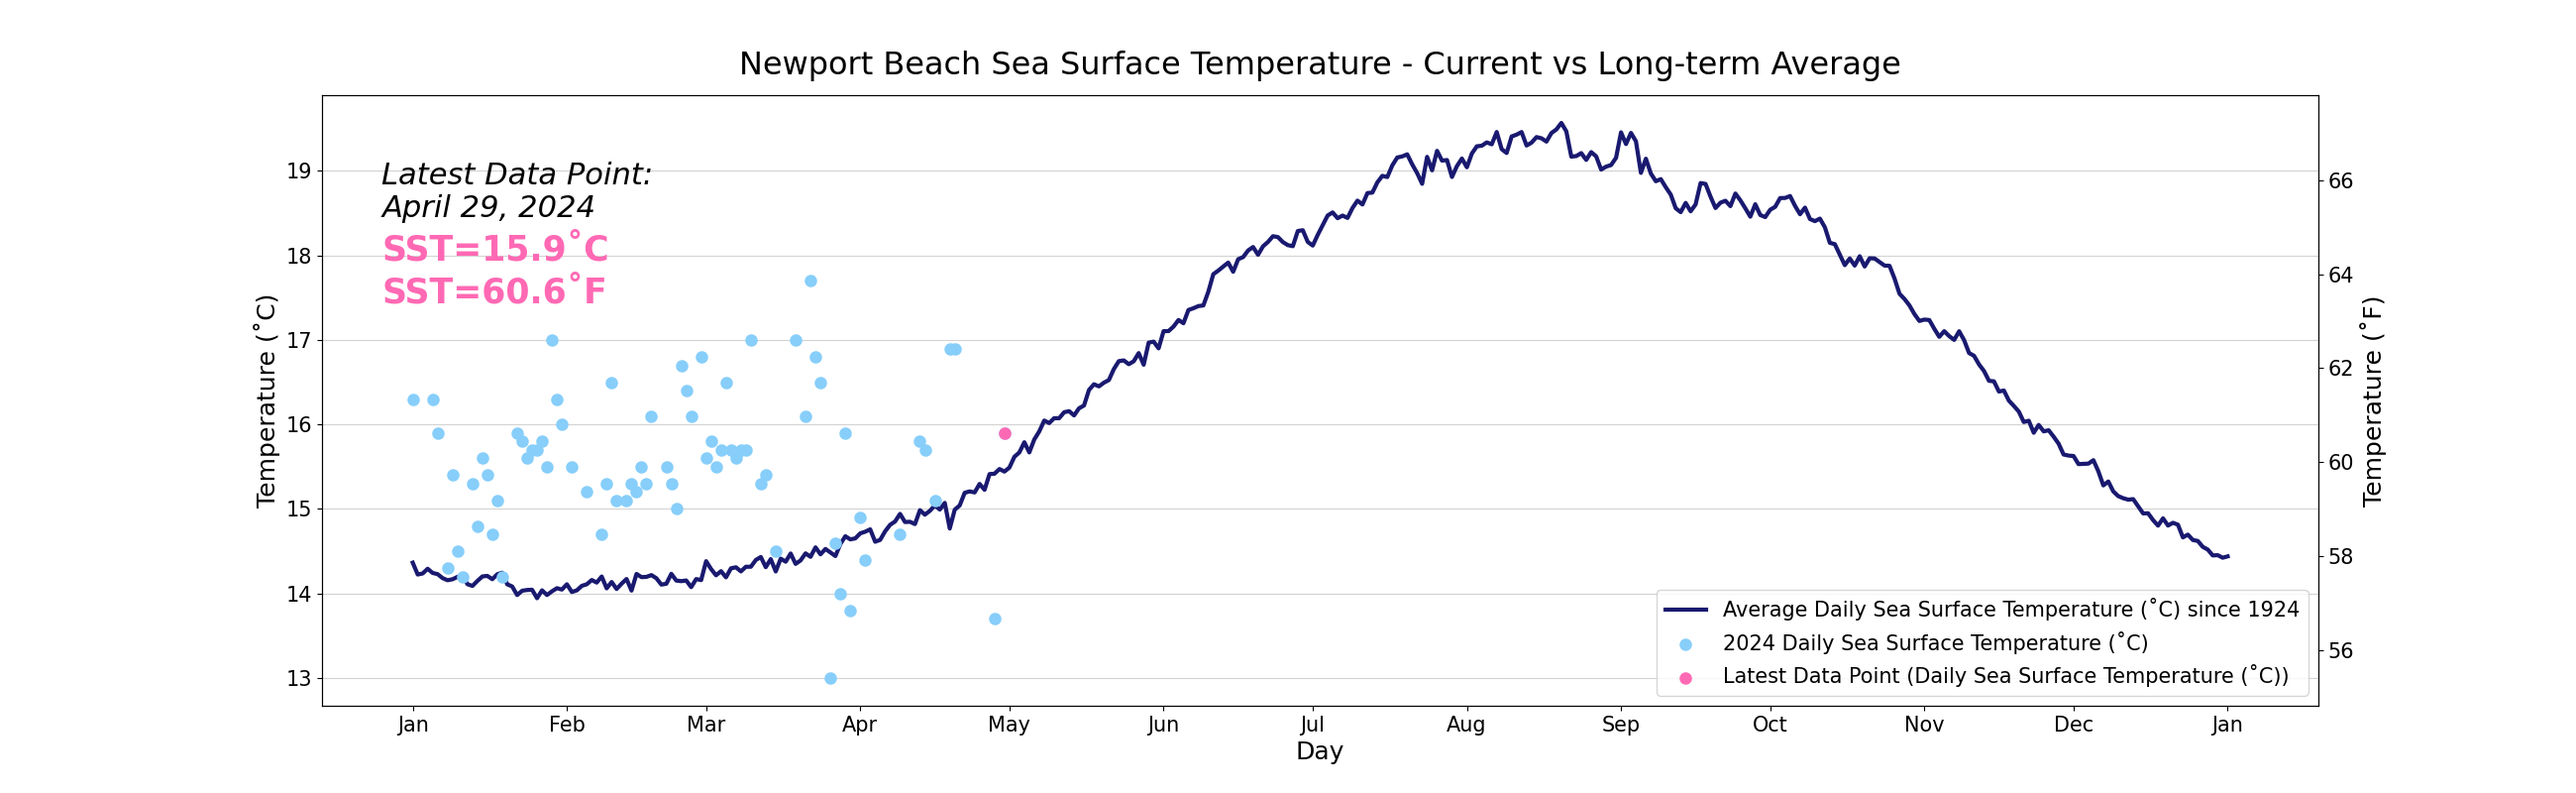
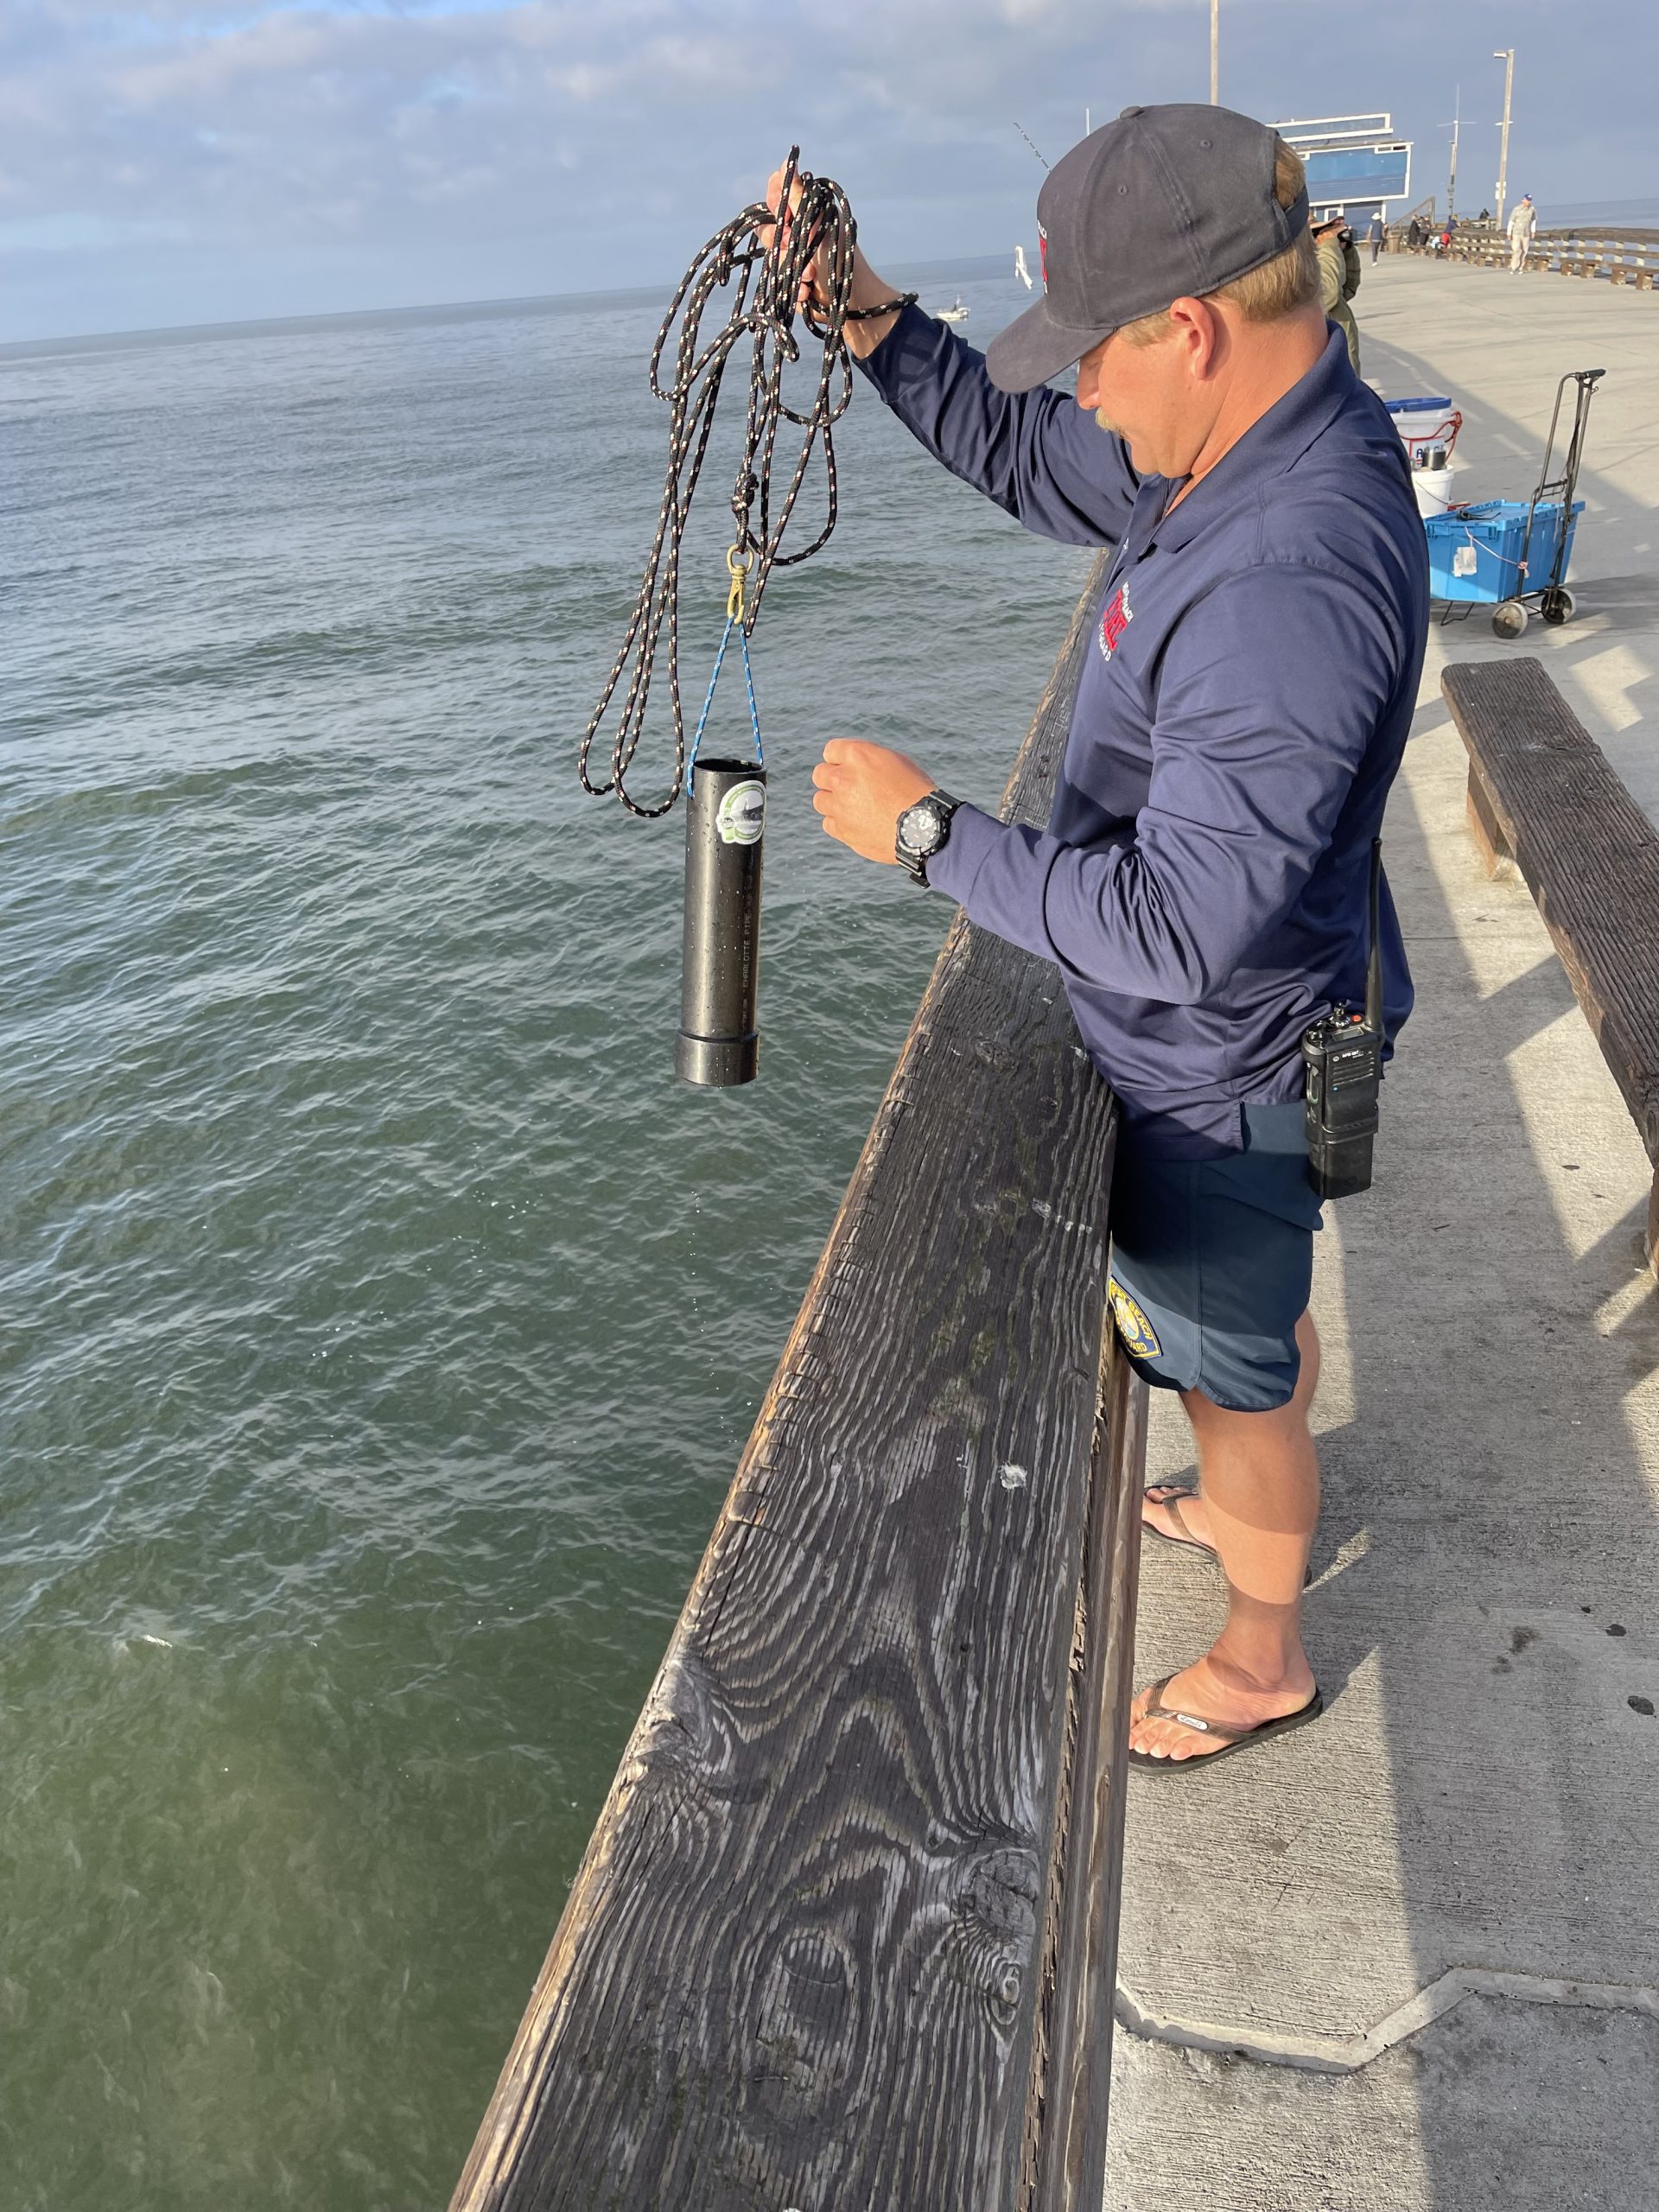
City of Newport Beach lifeguards take daily temperature and surface salinity samples from the waters surrounding the Newport Pier, which is located about two miles from the mouth of the Santa Ana River. Analysis of these salinity samples indicates that they reflect oceanic conditions except during winter storms when the salinity is strongly affected by runoff from the river.
Starting in 1924, these data were recorded predominantly from the Balboa Pier, which is located just 1.7 miles southeast of the Newport Pier. The sampling location changed to Newport Pier in the mid-1950s. Daily temperature measurements from 1979 to 2012 were read from a fixed thermistor near the end of the pier. For the last several decades, however, the data has been collected almost exclusively from the Newport Pier. These sites are so similar that the data collected from either location are consistent with the long-term record
Click here to access Newport Beach data from 1924-current
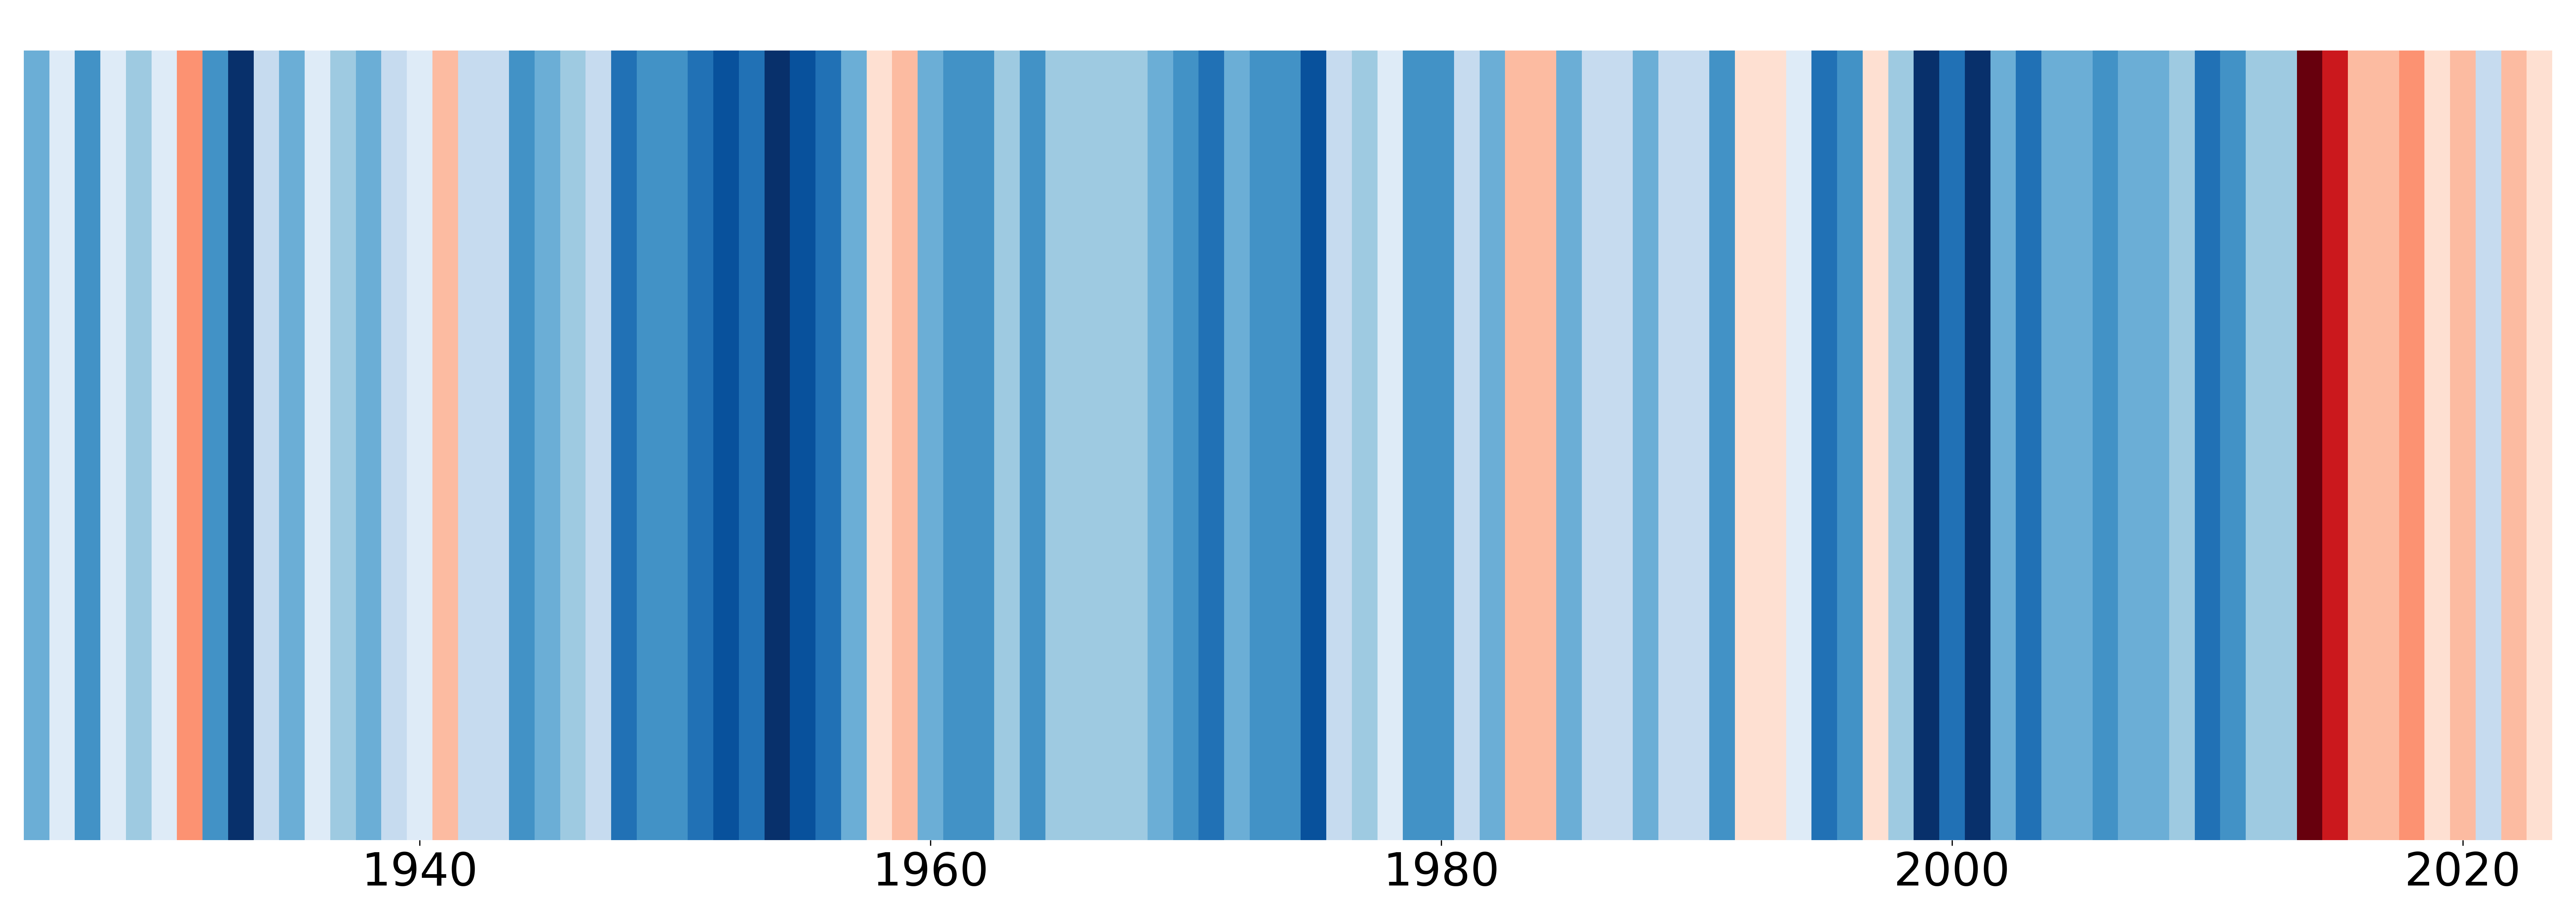
Below are figures that we have modeled after the #ShowYourStripes Campaign (created by Ed Hawkins), to help us visualize how sea surface temperature has changed at the Newport Beach Pier since 1924. The change in temperature is relative to the average temperature calculated between 1924-2023.
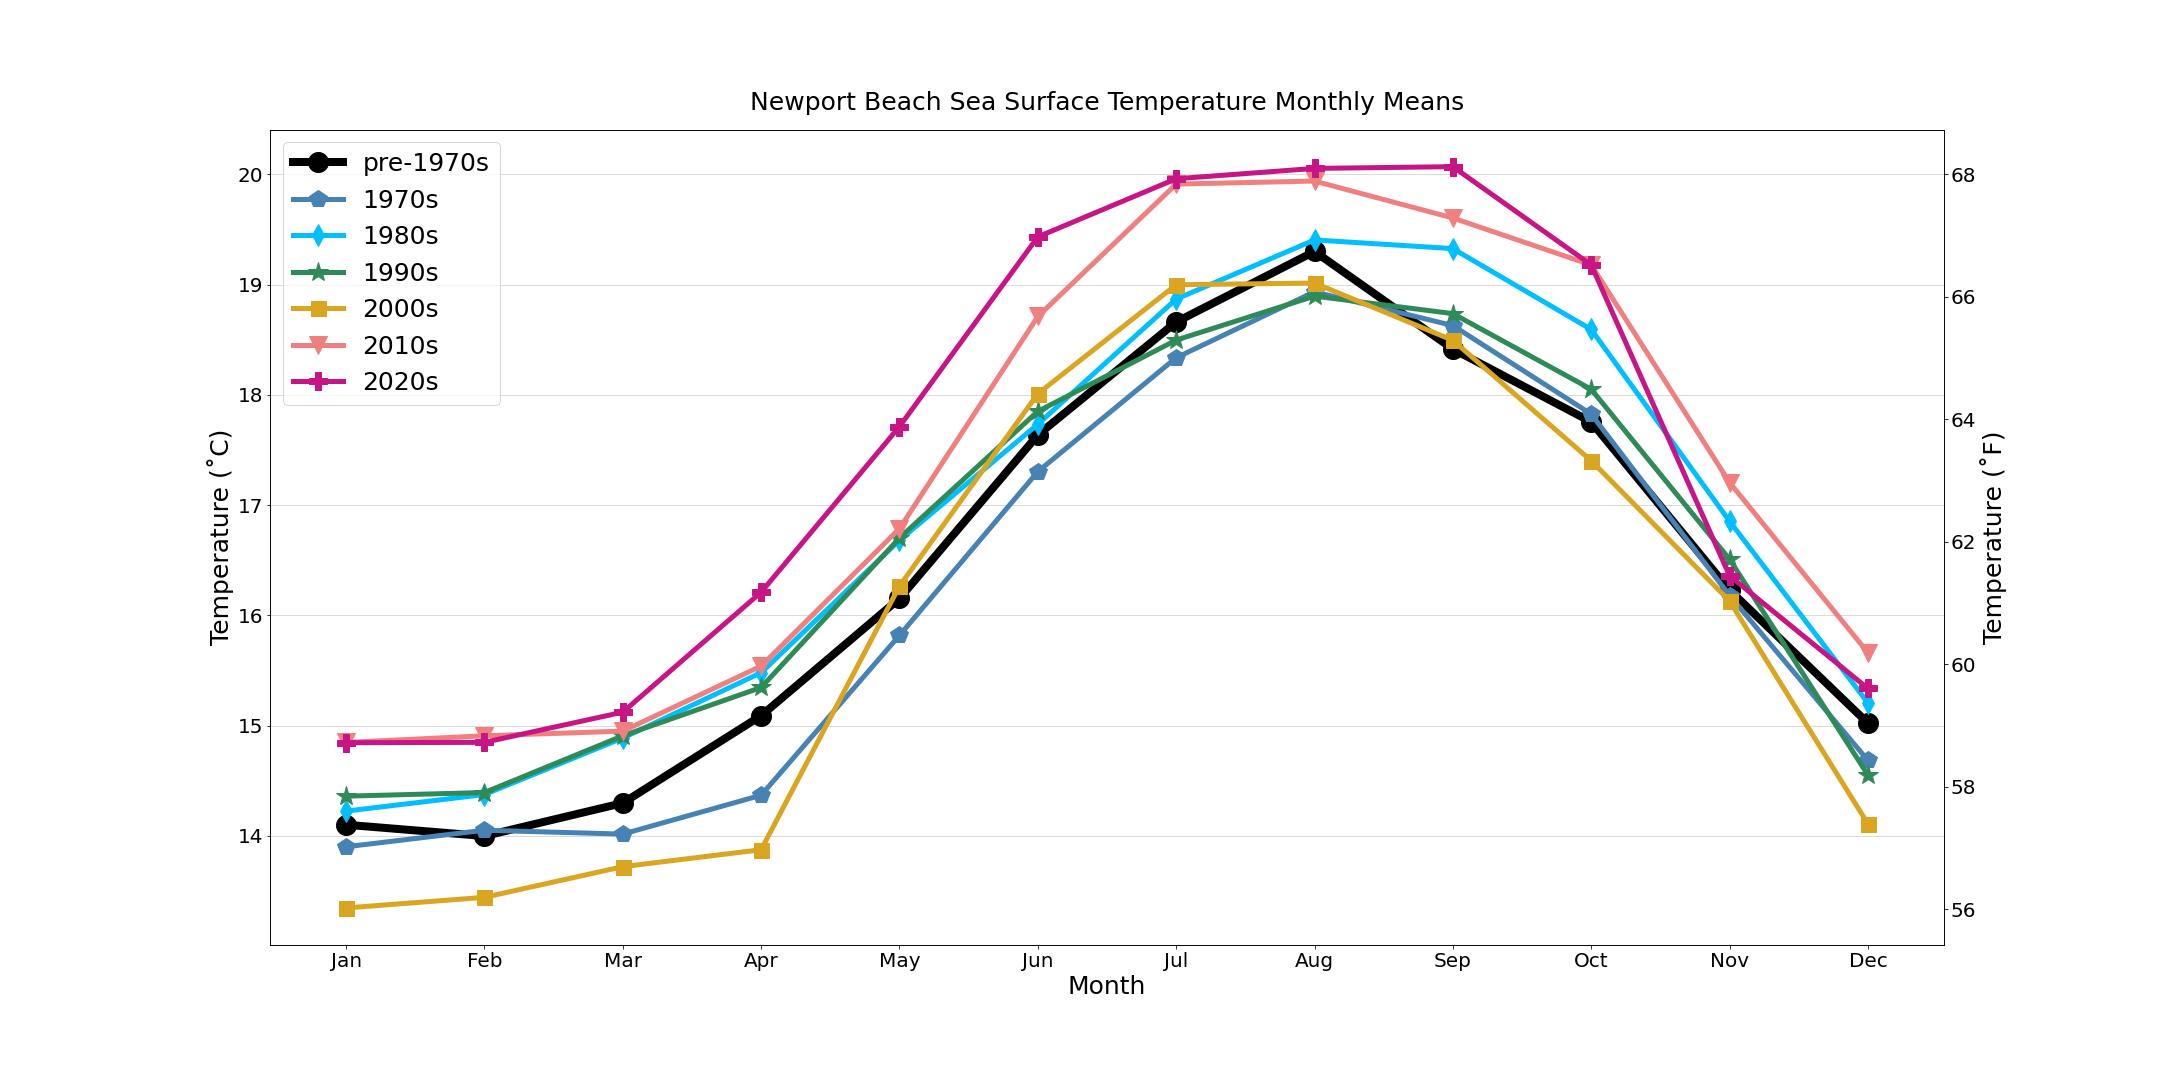
Below you can see a plot showing Monthly Sea Surface Temperature and Salinity Averages from the Newport Beach Shore Station, split up by decade, since 1970.

Recent Data